Reviewed by: Lazarev.agency Product Strategy Team
Last updated: December 2025
Expert sources: Mixpanel, Adjust, Business of Apps, Stripe, Lazarev.agency case studies
To reduce customer churn, improve the moments where users lose momentum: onboarding clarity, return triggers, perceived progress, and role-specific value delivery. The most effective churn reduction comes from UX patterns because UX changes compound across the entire customer lifecycle.
Key takeaways
- Reduce friction in the first 7 days; most churn decisions are made instantly.
- Treat each user segment differently; role-specific UX = lower drop-offs.
- Replace choice overload with curated flows and focused narratives.
- Instrument early-warning signals (cohorts, repeat actions, sentiment).
- Tie churn math to revenue math so retention efforts drive NRR and LTV.
- Learn from what works: mental health, wellness, e-commerce — the same UX levers apply.
When Customer Acquisition Cost (CAC) keeps climbing, the fastest growth lever is to keep the customers you already won.
This article shows exactly how our team managed to reduce customer churn across 3 very different products:
- a mental health app,
- a digital wellness platform,
- and an e-commerce brand.
Which design decisions turned one-time visits into return behavior? Read the full article!
How to reduce customer churn: measure what matters before you act
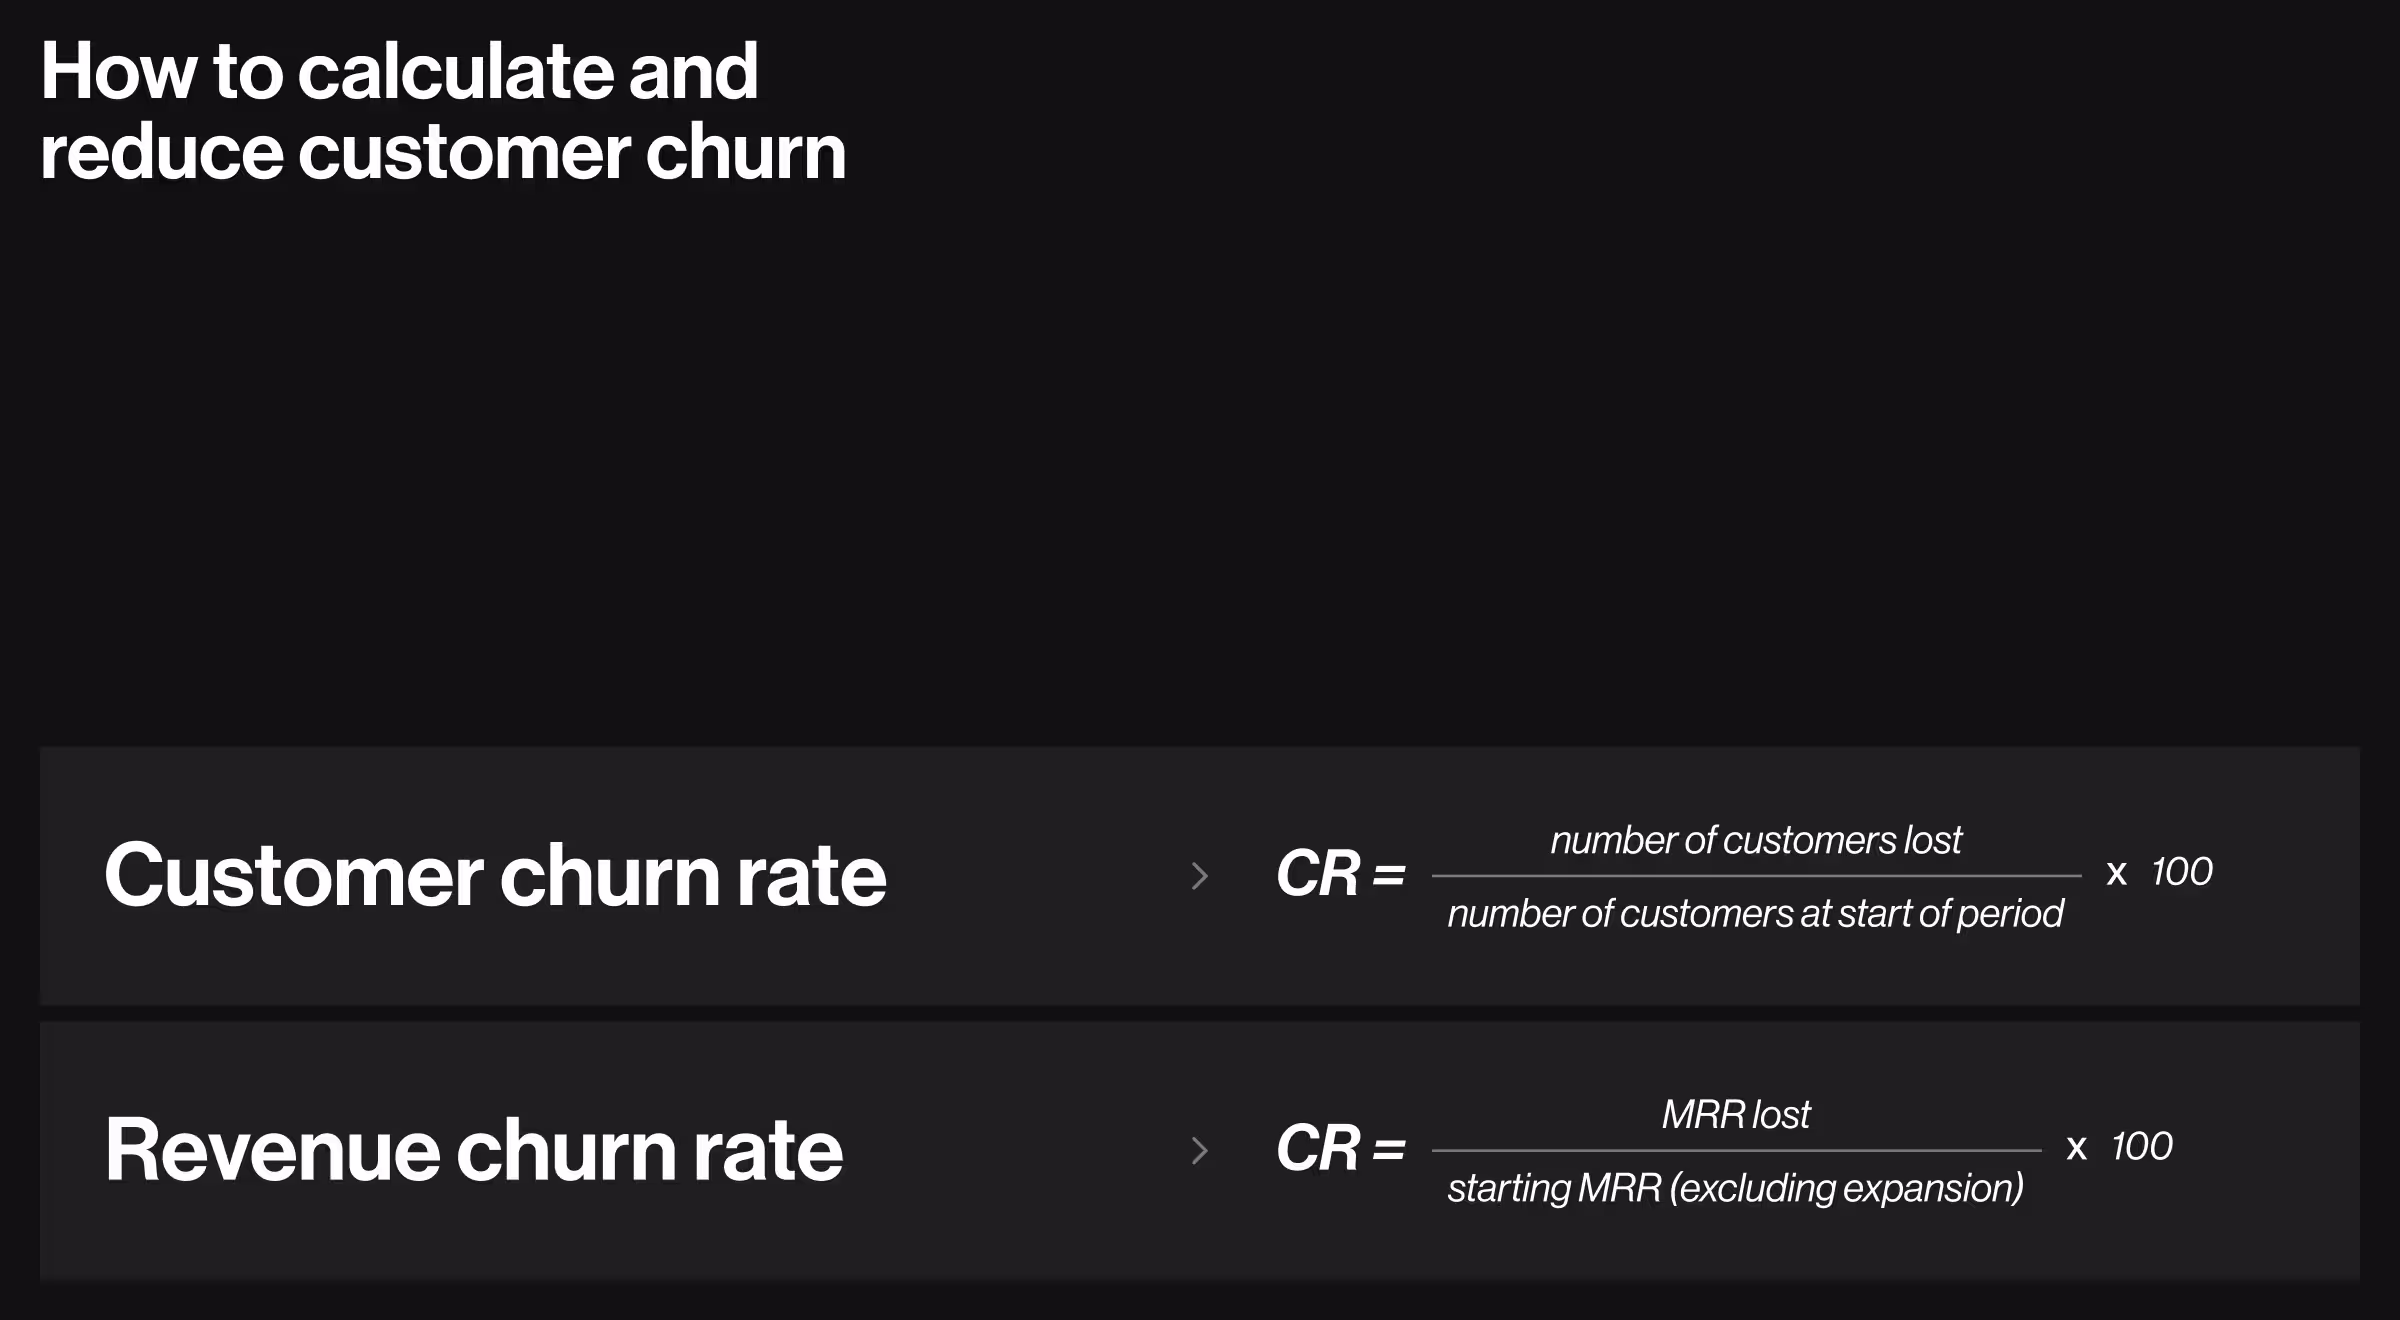
The Churn Rate is the percentage of customers who stop using or paying for your product in a given period.
If you don’t baseline, you can’t improve. For any SaaS business or membership product, start with a clear customer churn rate definition and a simple formula:
- Churn Rate = (number of customers lost ÷ number of customers at start of period) × 100.
- If you track Revenue Churn, use Monthly Recurring Revenue (MRR) lost over starting MRR (excluding expansion).
To start working with your own churn, set up D1/D7/D30 retention with cohorts. These three moments are the backbone of churn work and the most reliable way to calculate customer churn rate equivalents via retention views. Mixpanel’s Retention report and Adjust’s cohort guidance both emphasize these checkpoints.
💡 Pro tip: define both voluntary churn (users who actively cancel) and involuntary churn (payment failures). Treat them as different problems with different fixes.
Set goals against public baselines (Android ~21% D1, ~2% D30; iOS ~24% D1, ~4% D30) and benchmark before labeling churn. Recent datasets show typical n-day drop-offs.

With baselines set, we move from metrics to mechanisms — what the product does to reduce customer churn every day.
What UX strategies actually reduce customer churn? 8 proven tactics from real products
Strategy 1 — rebuild the first 7 days around habit
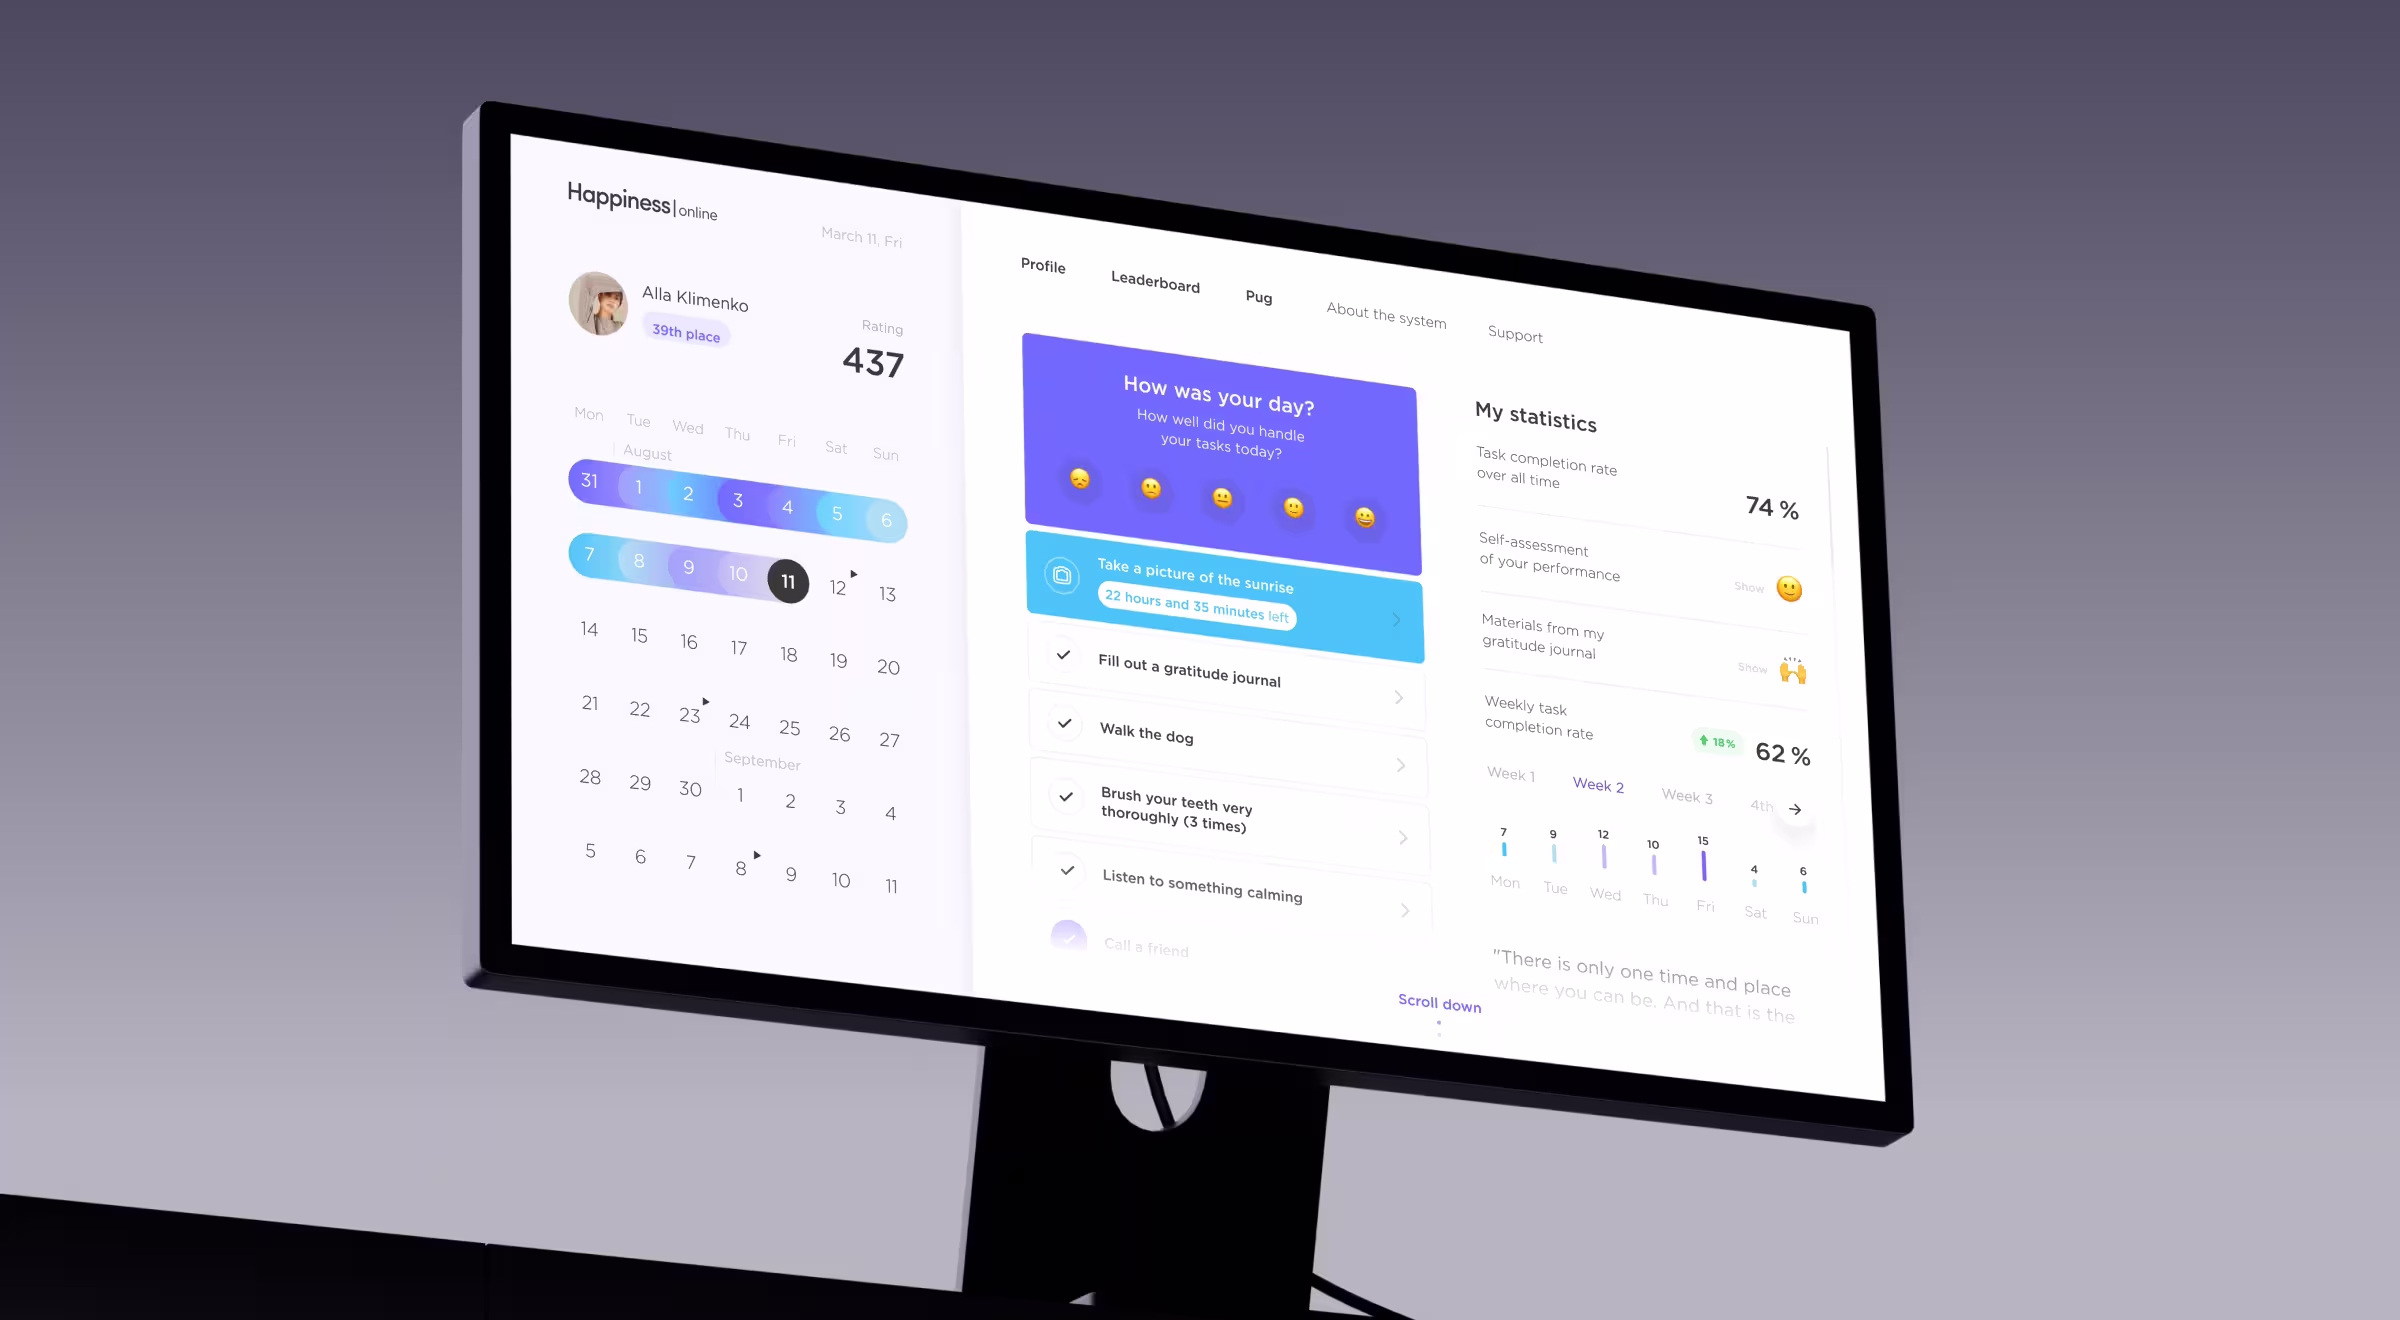
On Happiness — a six-week mental wellness journey — the product saw customer retention rise by 42% after launch. That outcome validates a simple thesis: design everyday progress cues and ritual return triggers, and you get more loyal customers coming back.
What you can adapt to retain customers:
- Treat D0–D7 as a “momentum engine” with visible progress, tiny wins, and consistent return cues.
- Make customer expectations explicit: what happens today, what’s next, why it matters for the customer journey.
- Use lightweight streaks, checklists, or journey maps to keep customers engaged without adding friction.
When value shows up in small, repeatable steps, current customers discover a reason to return on their own because we’re not offering incentives in a vacuum.
Strategy 2 — segment by role and personalize the core loop
WellSet serves employers (admins), employees, and direct consumers. Two result lines matter for churn work: +75% engagement after redesign and a 30% boost in customer retention.
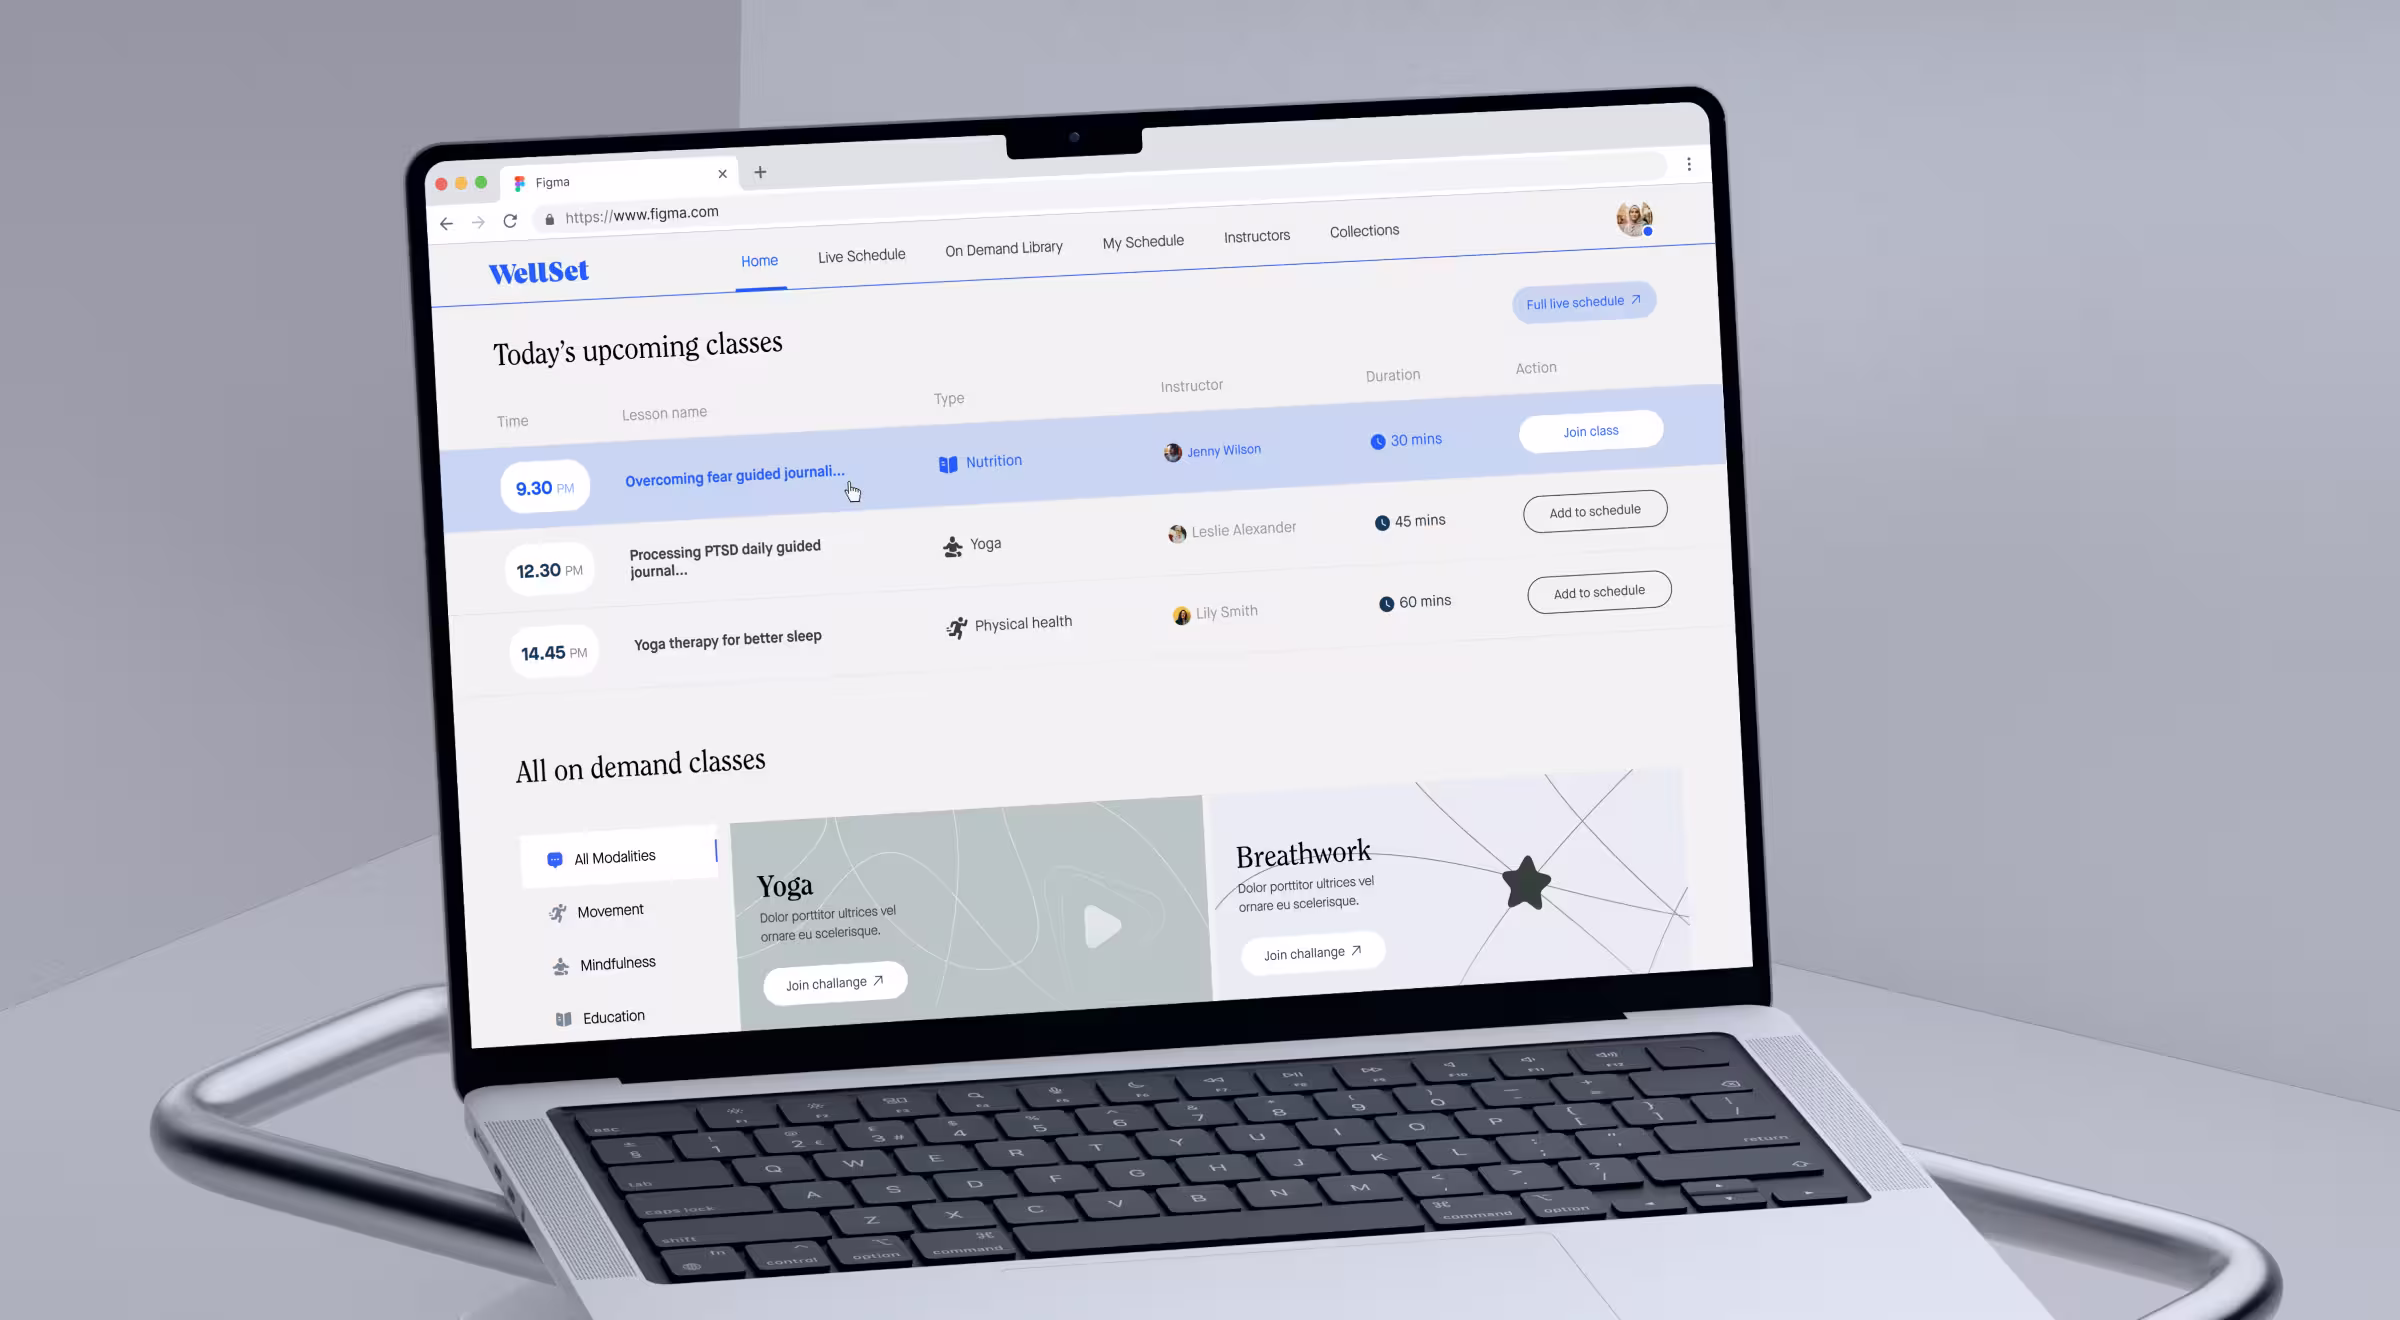
The challenge was to create an intuitive user experience tailored to each role that would foster consistent engagement. The redesign tailored journeys to each role and made wellness content easier to access.
Design mechanics you can reuse to reduce customer churn:
- Live Schedule and On-Demand Library visible where decisions happen, with “Join class”/“Add to schedule” CTAs and clear timers for upcoming sessions.
- A dashboard that surfaces onboarded members and repeat classes usage — practical early indicators you can track to prevent churn before it hits.
Role clarity + utilities that create reasons to return = fewer churned customers. You’re improving customer experience and customer satisfaction by aligning flows to jobs-to-be-done, which strengthens customer relationships and customer loyalty over time.
💡 Pro tip: track customer feedback alongside behavior. When “repeat class usage” dips or customer sentiment sours, trigger customer success outreach before renewal.
🔎 Want to know how to reduce customer churn using UX personas to drive return behavior? Read our article: “UX persona examples from real projects with practical tips”.
Strategy 3 — collapse choice overload with focused narratives
Mariemur faced a classic e-commerce friction point: 73% of users abandoned the site between the homepage and product pages across 120+ items in 14 categories. The fix was intentional focus: a single immersive landing page that showcased 4 exclusive sets, which doubled engagement and later reported 50% higher engagement driven by emotion-first presentation.
Narrowing the path reduces wandering and losing customers to paralysis. A curated story, supported by sharp mobile layouts, helps retain attention within the customer lifecycle and nudges more sessions toward purchase, especially on small screens.
Strategy 4 — make progress visible and friction invisible
Across these products, return behavior grew when progress was obvious and next steps effortless:
- Happiness: mobile-first views with clear progress signals — a structure that fosters customer loyalty through repeat wins.
- WellSet: home built around “Live,” “On-Demand,” “My schedule,” and “Collections,” with timers that create urgency and reasons to return.
Tie these UX moves back to metrics: better guidance and clarity improve customer retention, lower customer attrition, and ultimately extend customer lifetime.
Strategy 5 — instrument early-warning signals and act
Early signals beat lagging realizations. In WellSet’s admin view, onboarded members and visualizations of class attendance make it easy to spot at-risk cohorts and intervene — for example, nudging schedule adherence or surfacing relevant classes to existing customers.
Pair leading indicators with outcomes: monitor retention, churn rate, and revenue churn by cohort so teams see whether interventions work across the customer base.
Strategy 6 — set expectations with external benchmarks
Calibrate what “good” looks like. Public datasets emphasize viewing retention as n-day curves and cohorts:
- Adjust: track return rates at D1/D7/D30 to understand the arc of engagement and where customers leave.
- Business of Apps (2025): current averages by OS (Android ≈ 21% D1 → 2% D30; iOS ≈ 24% D1 → 3–4% D30). Use these to sanity-check monthly churn rate expectations and to stress-test churn reduction targets.
- Mixpanel: how to structure retention/cohort analysis so experiments translate into product decisions.
💡 Pro tip: pair retention with value metrics (feature adoption, “minutes engaged,” repeat actions) so you tie churn reduction initiatives to outcomes, not output.
Strategy 7 — make feedback loops continuous
Use in-product micro-surveys, qualitative customer feedback, and CS touchpoints to identify dissatisfied customers early. Feed that insight into backlog triage and UX polish. The goal: improve customer retention by closing gaps that lead to bad customer service experiences.
Strategy 8 — connect churn math to revenue math
Executives care about impact. Track both logo and revenue versions:
- Logo churn reduces the number of customers;
- Revenue churn shows how churn affects monthly recurring revenue and which are your most valuable customers.
For finance-grade clarity, use the Stripe formula to calculate customer churn and a revenue formula for MRR/ARR churn. This helps you prioritize segments and protect valuable customers first.
Prevent customer churn with role clarity and risk scoring
If you run a membership or SaaS model, your playbook to reduce subscription churn starts with:
- clear owner vs. user roles (who buys vs. who uses),
- a cadence that creates reasons to return (schedules, feature drops, value updates),
- dashboards that expose early weakness before renewal (onboarding completion, repeat usage).
This is the same foundation we used on WellSet, and it’s the most durable way to prevent customer churn and to reduce subscription churn without gimmicks. Tie interventions to cohort improvements in customer retention rate, expansion, and NRR to show movement in customer lifetime value.
Thinking about how to reduce customer churn rate?
If your existing customers are slipping or you’re losing clients after the first month, let’s map the ROI of churn reduction strategies before another quarter passes. We can audit your onboarding, build cohort dashboards, and redesign the loops that keep customers engaged — starting with your most valuable customers.
Let’s design your churn-reduction roadmap together — contact us!
Our product growth design services and UX research consultancy services combine cohort analytics with retention-focused UX to reduce customer churn and protect revenue.


.webp)


.avif)