
When business leaders attempt to measure UX ROI in short-term monetary terms, they miss leading indicators of long-term return. A redesign that improves onboarding completion by 25% may not show immediate revenue impact. But it strengthens retention and improves the potential for expansion.
“No successful product is built on founder perception alone. It’s built on data. You measure what drives performance. For one company, that may be the conversion rate. For another, retention. For another, support volume. The point is not to measure what’s convenient. It’s to measure what moves the business forward.”
{{Kirill Lazarev}}
UX ROI should therefore be evaluated as a system performance improvement. Financial return is the result. Behavioral and operational signals are the evidence.
This guide explains how to measure the ROI of UX from a system-level perspective.
Key takeaways
- UX ROI is a system. Leading indicators like onboarding and retention move first. Revenue follows later.
- Small UX gains have a considerable financial impact. A 10% increase in UX budget can boost conversions by 83%. Poor usability can cost up to 35% of revenue.
- Behavioral metrics predict financial performance. Activation, add-to-basket rate, and engagement depth are early signals of lifetime value growth.
Business value of UX: what the data shows
Before calculating ROI of UX for your product, it helps to understand the broader market evidence. Multiple large-scale studies across industries demonstrate a consistent pattern: companies that prioritize design and user experience outpace their peers in revenue growth, shareholder return, customer retention, and overall business performance.
Here’s what the most cited research findings tell us about the correlation between UX and business performance.
- Design correlates with growth. Companies in the top quartile of McKinsey’s Design Index (MDI) achieved 32% higher revenue growth and 56% higher total returns to shareholders over five years.
- UX delivers exceptional ROI. Forrester found that every $1 invested in UX can return up to $100, equivalent to an estimated 9,900% ROI.
- Small UX gains drive big gains. Nielsen Norman Group highlights that 10% increase in UX budget can increase conversions by 83%.
- Poor usability costs sales. According to Amazon, poor design can forfeit up to 35% of potential revenue.
- UX issues fuel dissatisfaction. The McKinsey report points out that 56% of dissatisfied users blame digital UX/UI and lack of information for a sabotaged customer experience.
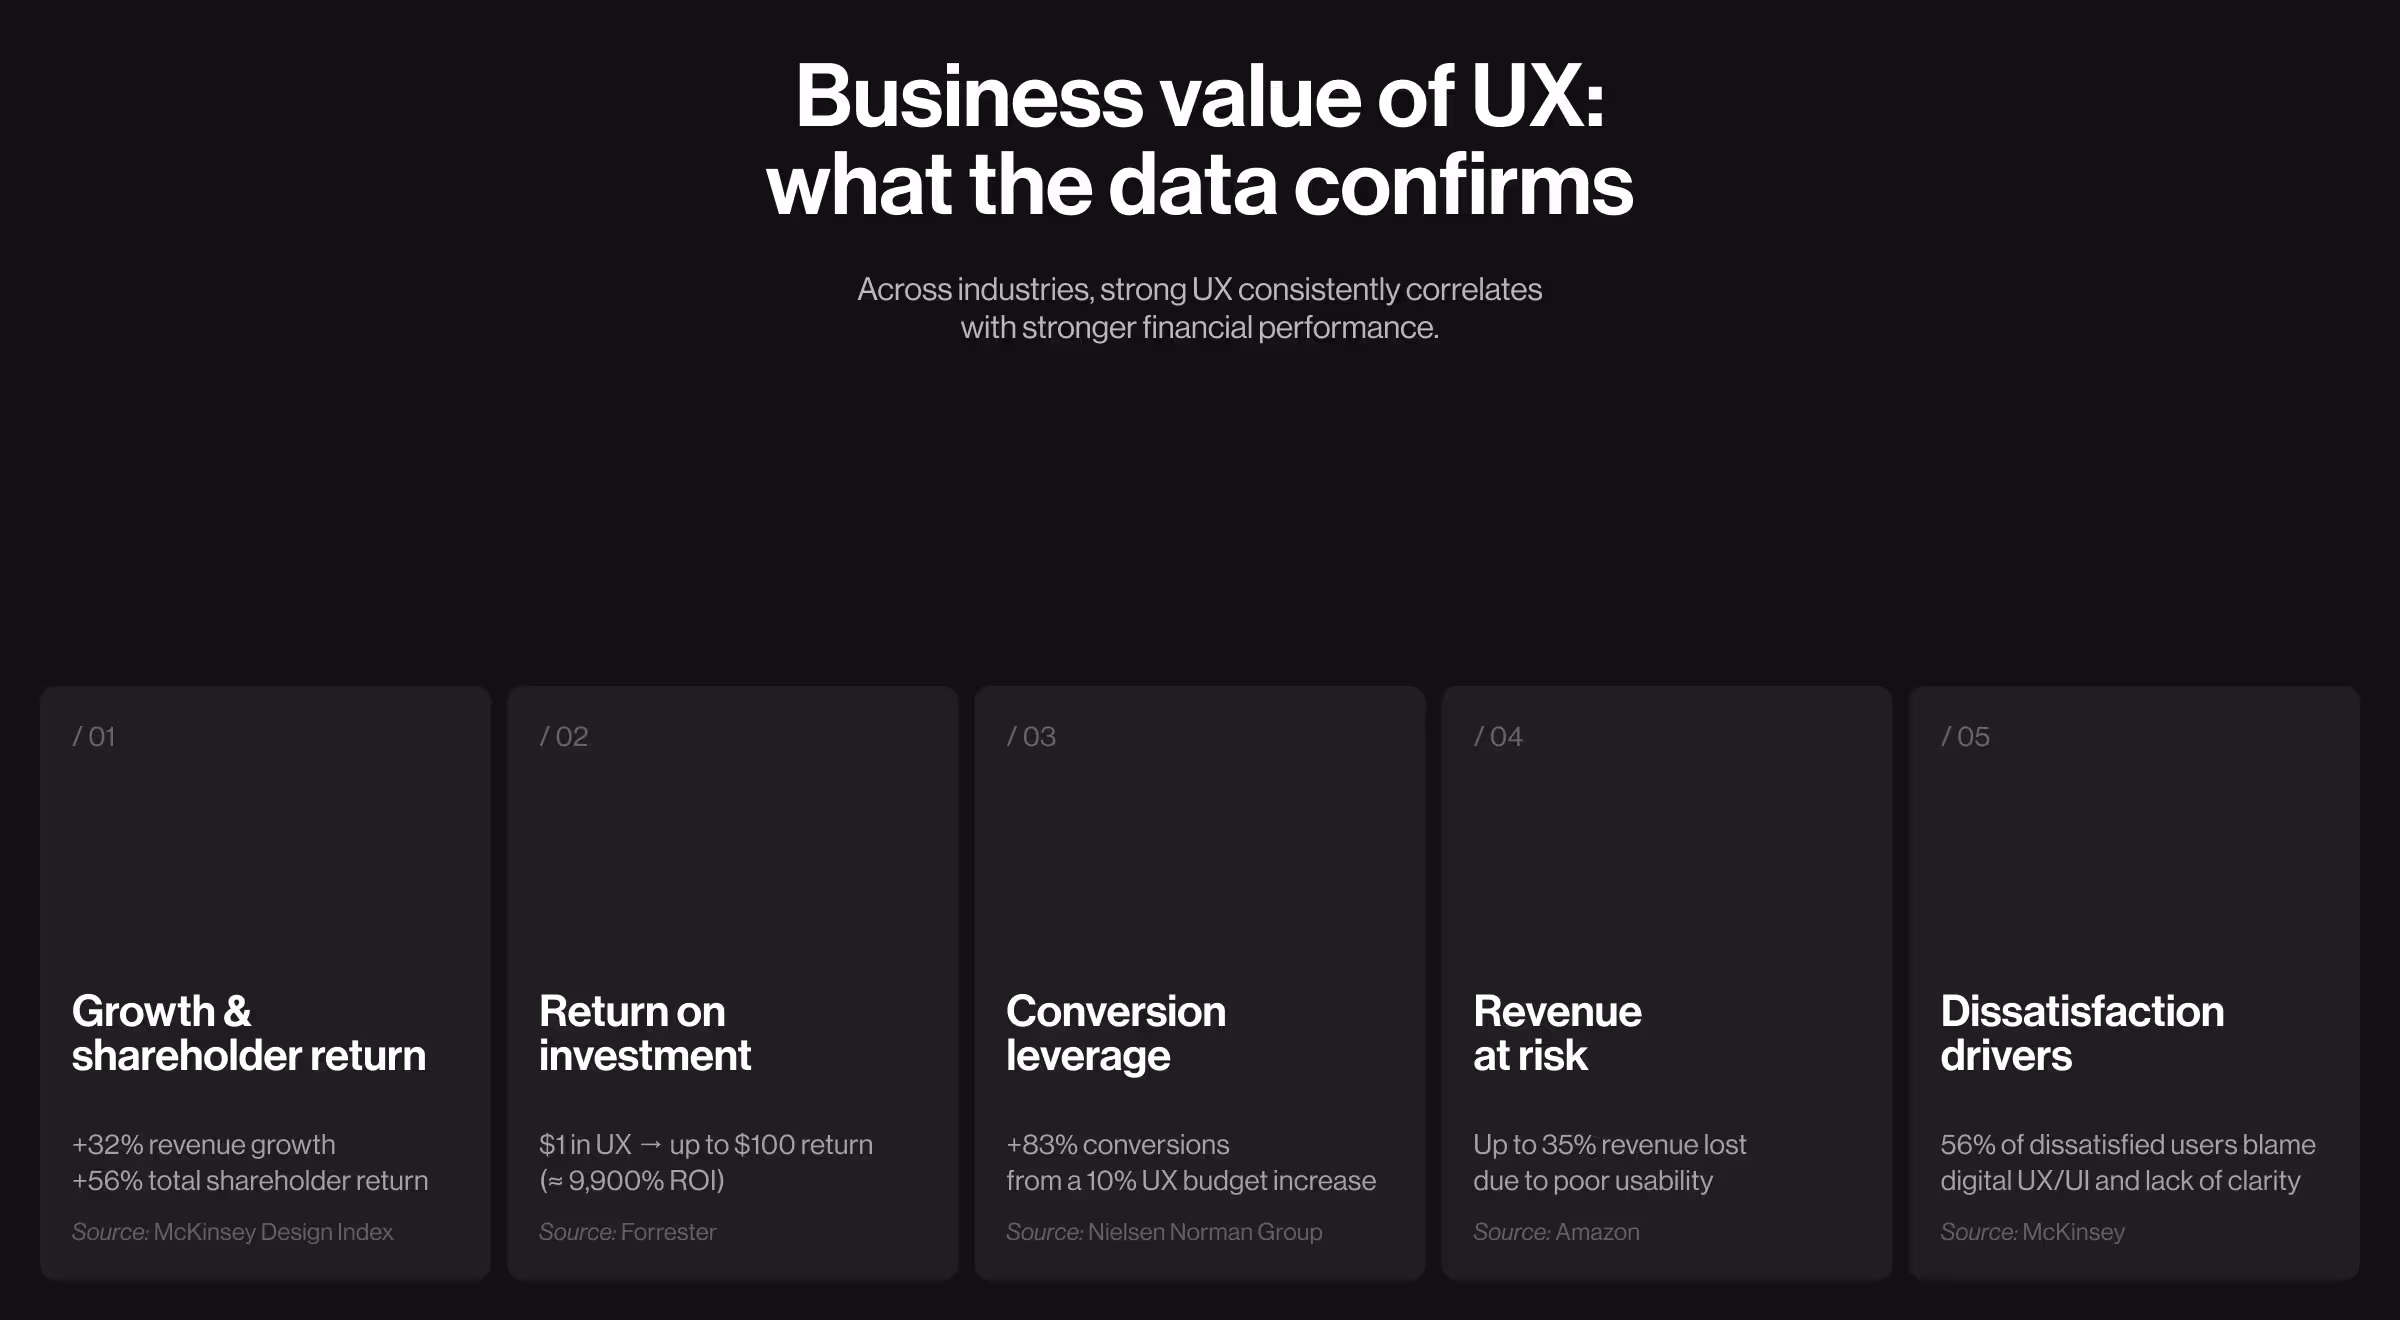
The pattern is consistent here. Solid user experience correlates with higher revenue growth, stronger shareholder returns, improved conversion efficiency, and reduced revenue leakage.
The implication for leaders is clear: UX is a performance variable.
Practical framework for measuring UX ROI
Measuring the ROI of UX requires structure. Without a framework, improvements appear isolated. With structure, they reveal a performance pattern.
The most reliable way to evaluate UX ROI is to map leading UX indicators to the lagging business outcomes they influence. Leading indicators shift first. Financial outcomes confirm the impact later. When you align both sides, ROI becomes visible and defensible.
Leading indicators shift first. Lagging outcomes confirm financial return later.
For example:
- If onboarding completion increases, activation rises.
- If activation rises, retention probability increases.
- If retention increases, lifetime value grows.
- If lifetime value grows while CAC remains stable, ROI improves.
This is how UX ROI should be modeled — as a logical, cause-and-effect chain.
How UX redesign impacts core business success metrics
“When founders ask me about the ROI of UX, they usually expect a revenue number. What I show them instead is a system. UX does not influence just one metric. It reshapes acquisition efficiency, qualification quality, activation speed, retention stability, and operational capacity. When those indicators move in the right direction together, revenue follows with mathematical consistency. In every serious product we’ve worked on, UX redesign was never a merely cosmetic adjustment. It was a structural performance intervention.”
{{Kirill Lazarev}}
In the section below, we examine each metric through a business lens: how it connects to ROI, and what its improvement points to.
Every metric is paired with a real case study from our portfolio to show how UX redesign stimulates tangible performance gains.
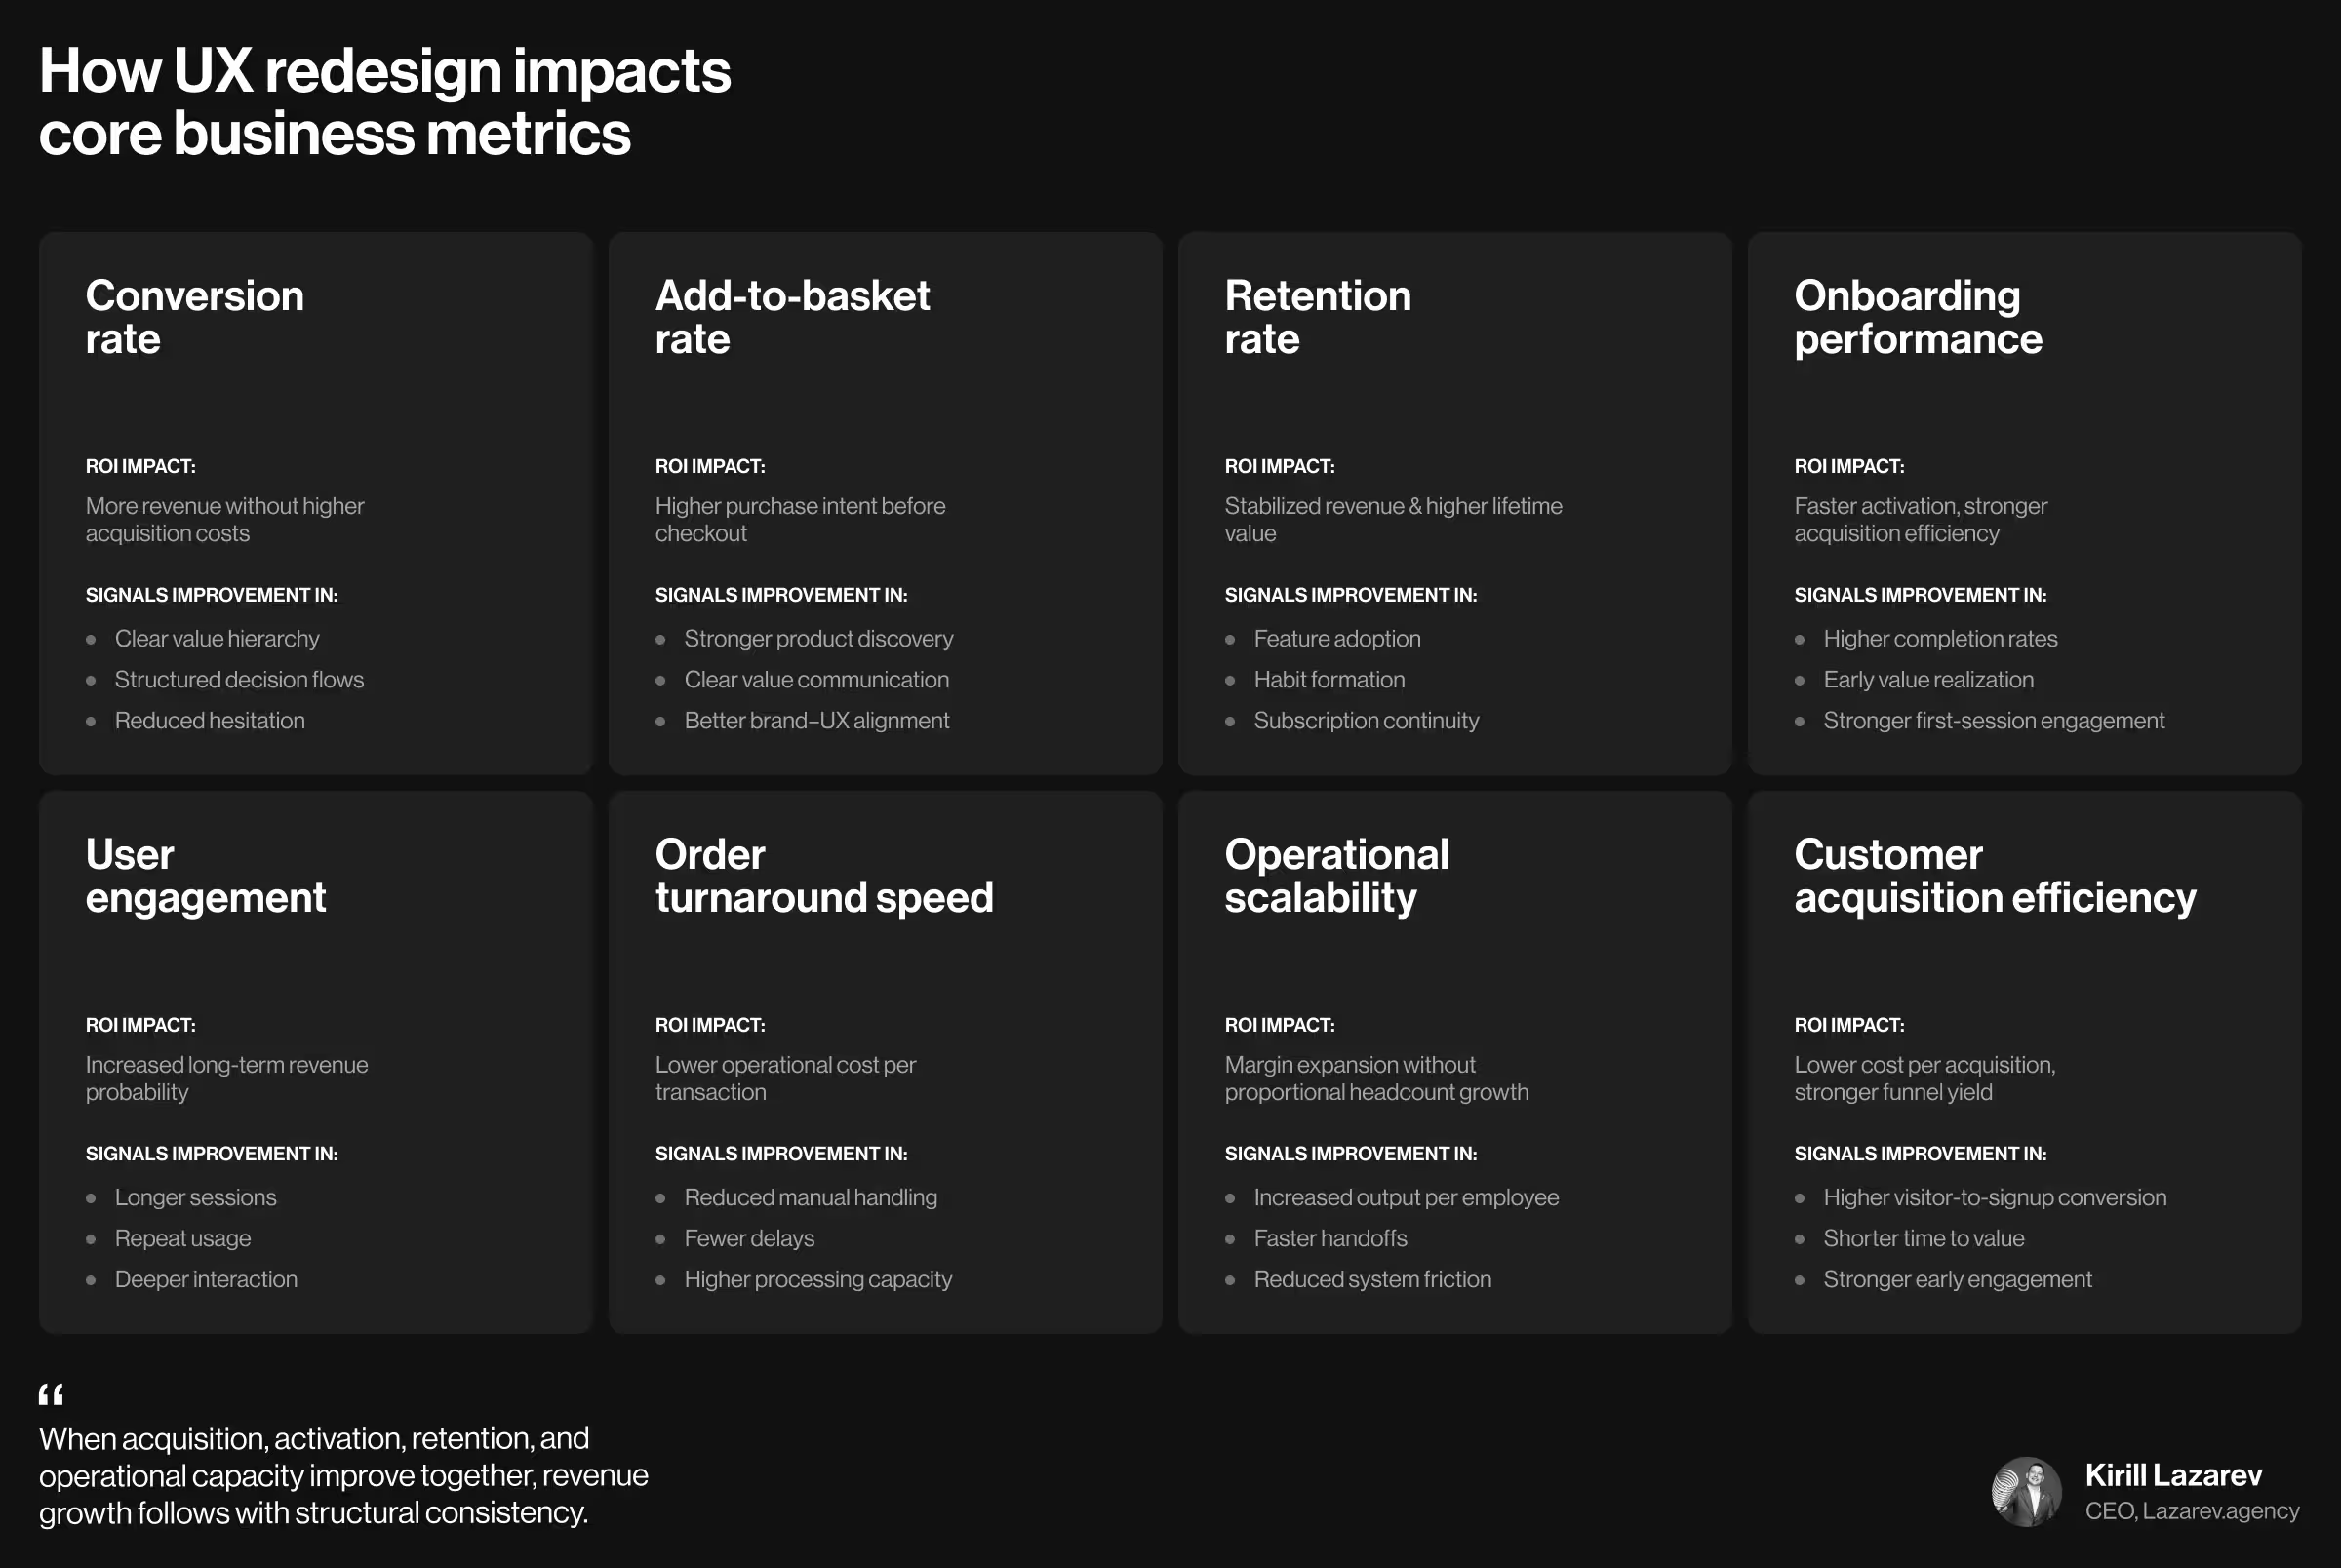
1. Conversion rate
📈 How it relates to business ROI: When conversion improves, revenue goes up without proportional growth in acquisition costs. It strengthens revenue per visitor and improves return on marketing investment.
✅ What a positive shift in this metric reveals:
- Clear value hierarchy and structured content pathways
- Stronger community positioning
- Reduced hesitation in decision flows
💼 Practical case: AfroTech needed a structural rebuild to become a digital hub for Black STEM professionals. Our design team led a full-scale transformation. We developed a comprehensive website, a dedicated conference mobile app, cohesive branding, and unified digital experiences across four platforms.
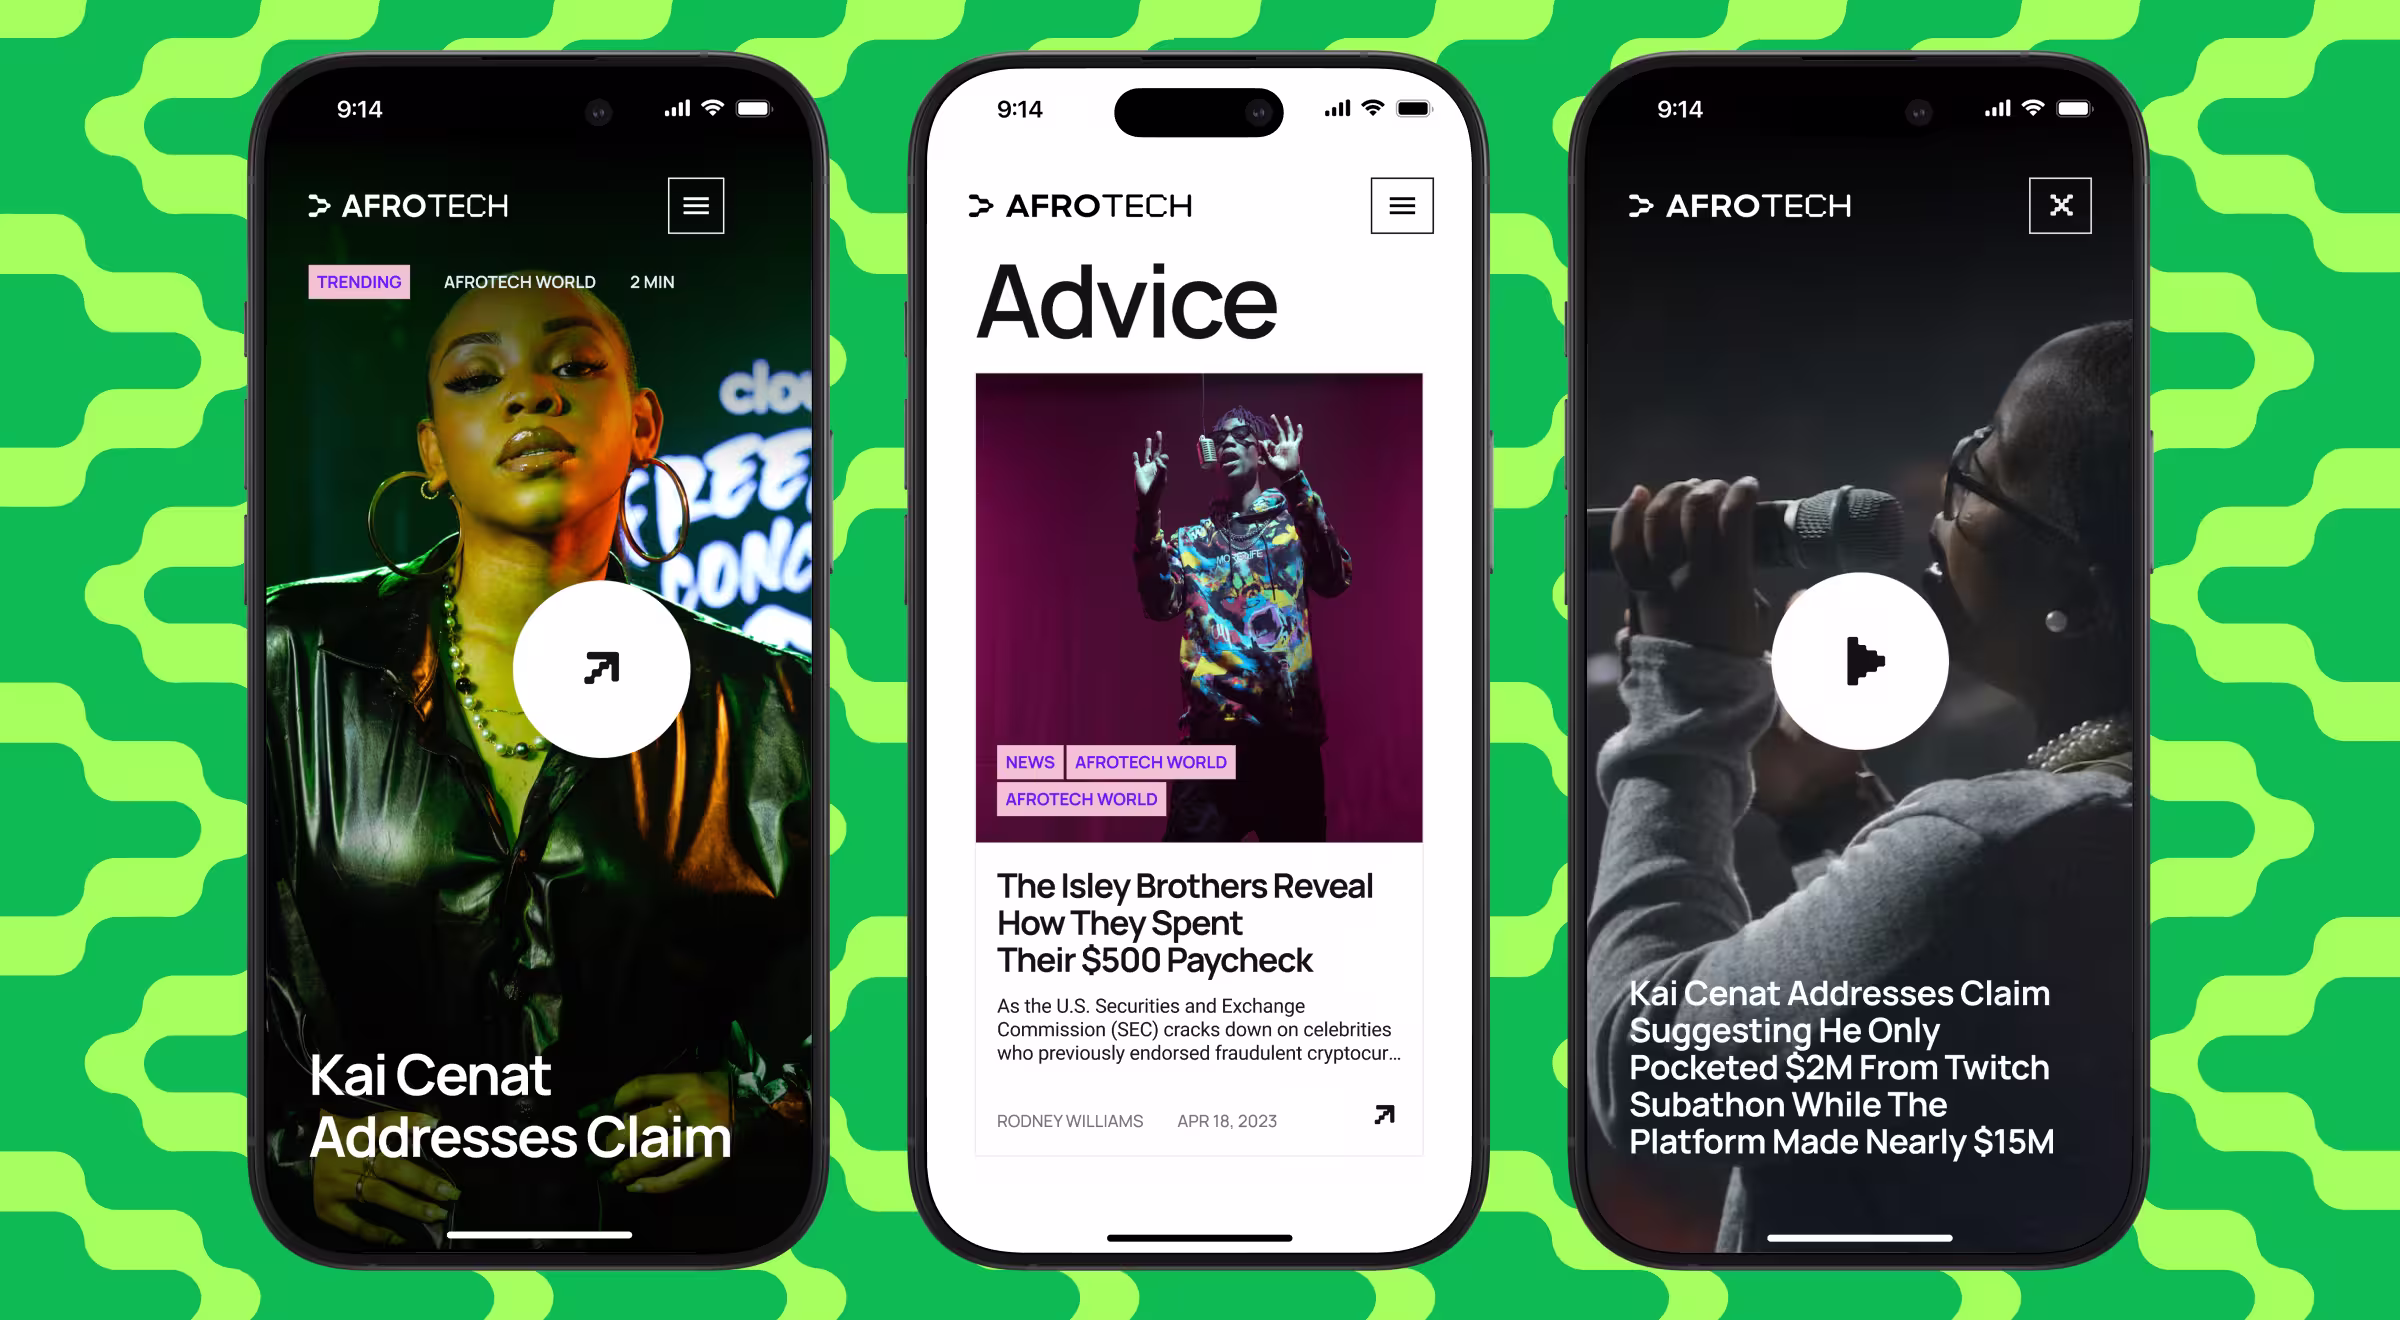
Results of the UX redesign:
- 5× increase in platform engagement over 3 years
- 25% retention boost after launch
- 30% engagement growth
- 20k+ annual conference attendees supported by a strengthened digital infrastructure
The increase in engagement and retention directly supports conversion performance. When users spend more time on the platform, interact more deeply, and return consistently, the probability of positive conversion dynamics increases.
2. Add-to-basket rate
📈 How it relates to business ROI: Add-to-basket rate is a critical micro-conversion metric in e-commerce. It reflects purchase intent before checkout. When it improves, revenue potential increases without additional traffic acquisition.
✅ What a positive shift in this metric reveals:
- Stronger product discovery
- Clear value communication
- Better alignment between brand perception and digital experience
💼 Practical case: Hedonism Wines, a premier fine wine retailer, faced a gap between its lavish in-store reputation and its underperforming digital platform. Mobile users dominated traffic. The lack of cross-device optimization led to high bounce rates and abandoned carts. Lazarev.agency led a mobile-first redesign focused on clear navigation and an intuitive user journey.

Results of the UX redesign:
- 45% increase in add-to-basket actions across all devices
- 54% increase in add-to-basket actions through optimized navigation
- 2.8× more customers progressed from browsing to checkout
The improved add-to-basket rate marked a stronger buyer confidence and a digital experience aligned with premium user expectations — all of which increased revenue potential without raising acquisition spend.
3. Retention rate
📈 How it relates to business ROI: Retention stabilizes revenue and increases lifetime value. When users remain active, acquisition costs compound.
🔍 Learn more about how to improve customer lifetime value in our dedicated blog.
✅ What a positive shift in this metric reveals:
- Increased interaction time
- Greater adoption of core features
- Stronger subscription continuity
💼 Practical case: WellSet, a digital wellness platform offering 20+ evidence-based practices, faced a structural challenge. Despite a rich expert-led content library, users perceived the platform as passive. Engagement was low, and retention suffered. We rebuilt the experience to shift WellSet from a static content library into an active, habit-forming system. The redesign introduced:
- A personalized homepage with session timers and tailored collections
- Integrated live classes with interactive calendars and chat
- Adaptive recommendations aligned with user goals and behavior
- A calming visual environment designed to reinforce mental well-being
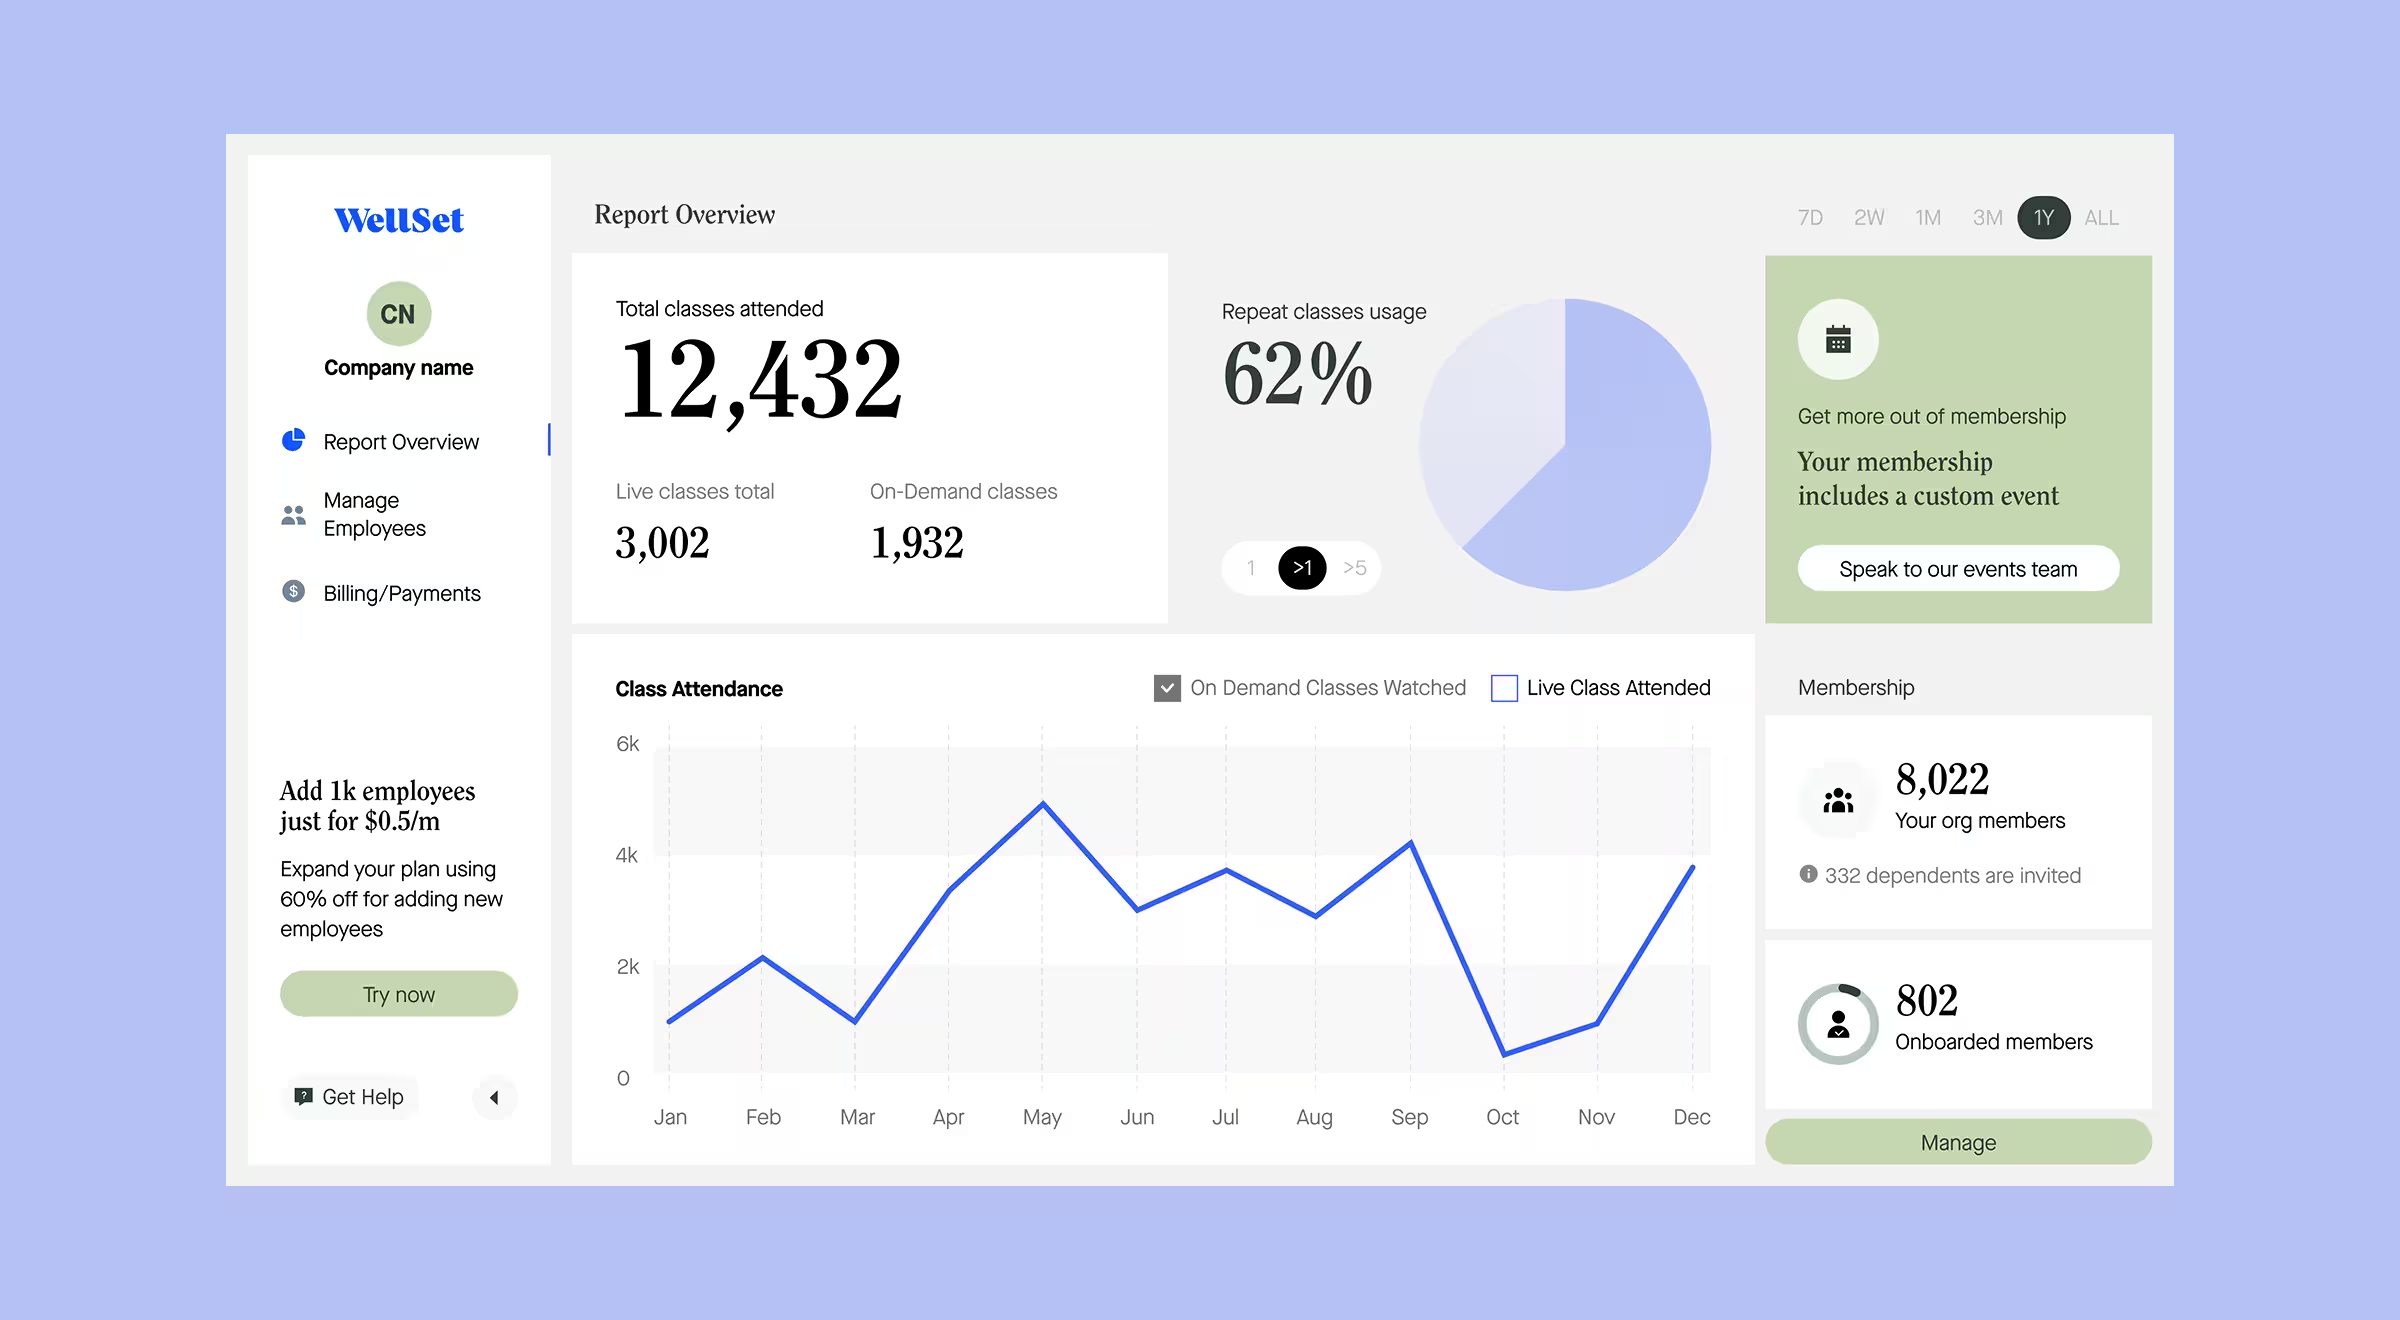
Results of the UX redesign:
- 75% increase in engagement
- 30% boost in customer retention
- 500K+ active users
- $3.1M+ raised in funding following platform transformation
🔍 Explore how to use UX design strategically to increase retention rates.
4. Onboarding performance
📈 How it relates to business ROI: Onboarding flow shapes the first impression and validates user intent at the earliest stage of product interaction. When users understand the product’s value right away and know what to do next, activation increases. Higher activation, in turn, strengthens acquisition efficiency and revenue.
✅ What a positive shift in this metric reveals:
- Higher form completion rates
- Stronger engagement
- Increased interest among qualified leads
💼 Practical case: NODO Film Systems needed a digital experience to match its Inertia Wheels MAX technology. The goal was to spread brand awareness and fuel early conversion through a waitlist system.

Lazarev.agency designed an immersive promo experience to highlight the product’s value proposition and showcase real-world use cases before presenting a clear subscription CTA. High-impact 3D visuals reinforced credibility, while the content flow directed users toward a single action: joining the waitlist.
Results of the UX redesign:
- 160 waitlist forms submitted after launch
- 106 completed forms within the first month
- 41% of waitlist subscribers were entirely new customers
- 8% increase in email audience during the first month
In ROI terms, the redesigned onboarding journey increased qualified acquisition and expanded audience reach without changing the core product. It converted interest into commitment — a direct signal of effective activation.
🔍 Strengthen your new customer onboarding using insights from our Lead Designer.
5. User engagement
📈 How it relates to business ROI: When session depth and interaction frequency increase, the probability of long-term revenue rises. Engagement is an early signal of product relevance.
✅ What a positive shift in this metric reveals:
- Longer sessions and higher repeat usage
- Increased content interaction
- Stronger subscription stickiness
💼 Practical case: Streamingbar, an online video platform, struggled with fragmented analytics and limited personalization. Administrators lacked actionable insight, while users experienced low personalization and reduced engagement depth.

Our team redesigned the platform by introducing:
- A comprehensive real-time analytics dashboard consolidating performance metrics
- Data-driven insights into geographic trends and content performance
- Personalized content recommendations based on viewing behavior
- A unified brand identity system reinforcing platform credibility and recognition
These strategic design modifications shifted the platform from a static content library to a responsive ecosystem. Personalization encouraged longer sessions and repeated engagement.
6. Faster order turnaround
📈 How it relates to business ROI: Order turnaround speed affects operational efficiency and customer satisfaction. Faster processing reduces internal workload, minimizes errors, and allows higher order volume without increasing headcount.
✅ What a positive shift in this metric reveals:
- Reduced manual order handling
- Fewer processing delays
- Higher order capacity
💼 Practical case: Royalty Apparel, a sportswear manufacturer serving U.S. college teams, faced a structural bottleneck. Orders were processed manually through phone and email, placing heavy pressure on the sales team and slowing production cycles.
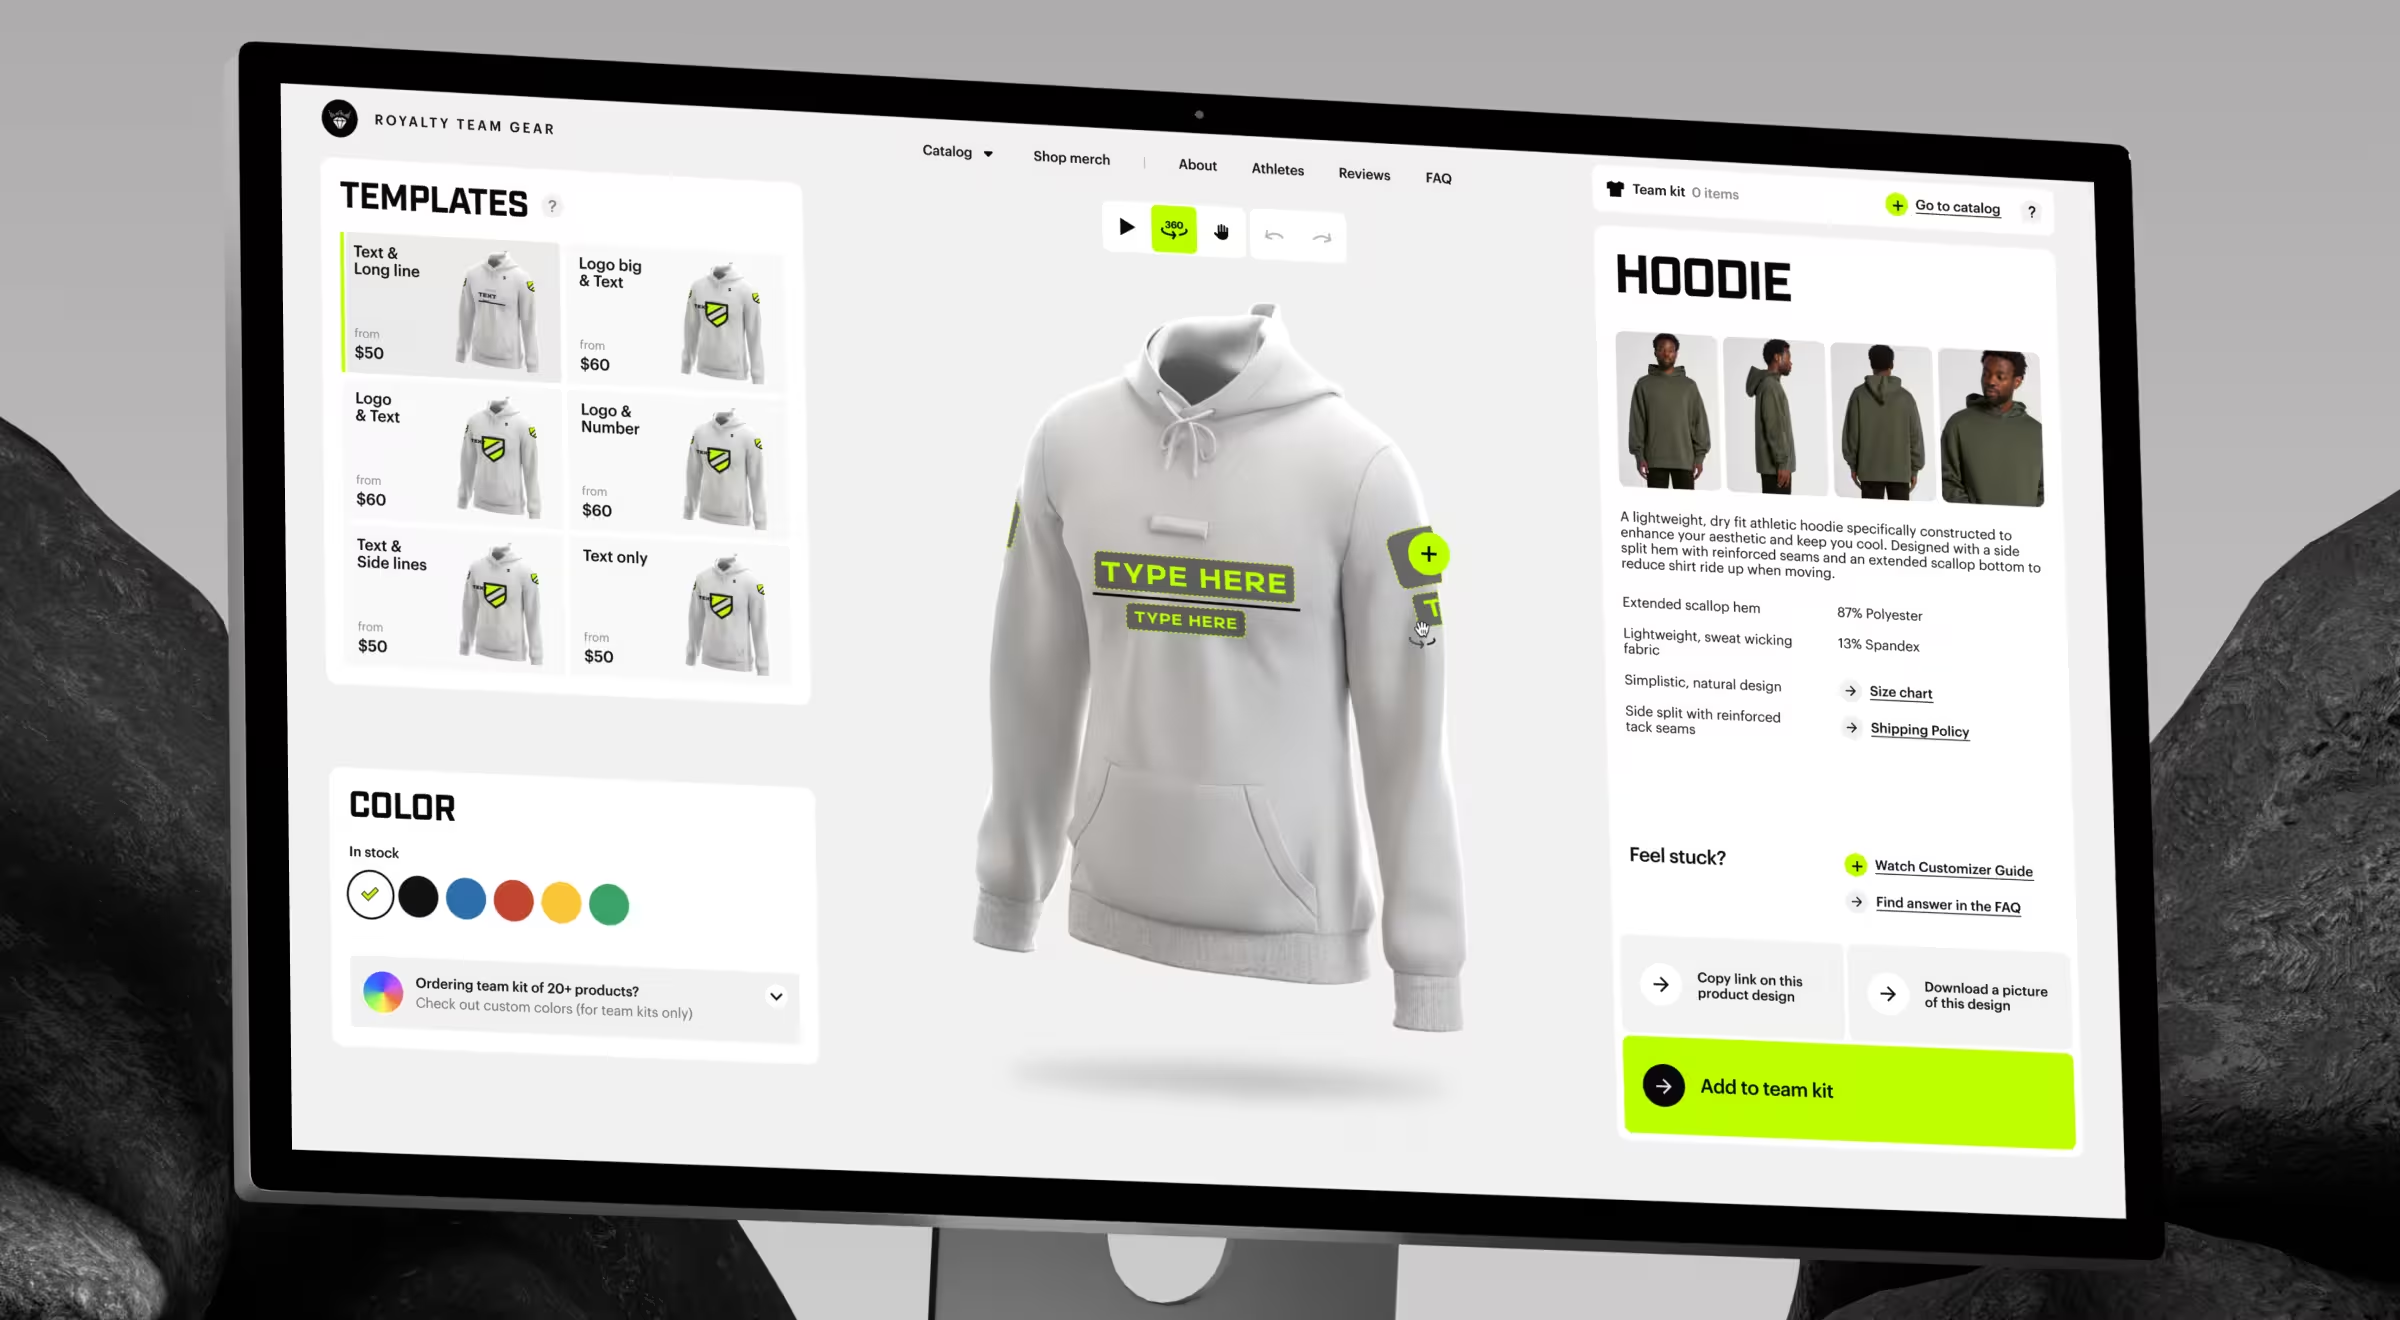
Our team transformed the platform into a self-service e-commerce hub. The redesign introduced:
- Automated order flows
- A no-code merch creator for team managers
- Streamlined kit ordering with full customization
- Interactive 3D product previews to strengthen purchase
Results of the UX redesign:
- 8× faster order turnaround
- 1,170 hours saved in product creation workflows
7. Operational scalability
📈 How it relates to business ROI: Operational scalability improves margin. When a company can serve more clients without proportional increases in labor or administrative overhead, revenue growth follows.
✅ What a positive shift in this metric reveals:
- Increased output per employee
- Reduced handoff delays
- Faster project completion cycles
💼 Practical case: SolarDrive installs solar panels across the U.S., managing workflows that span lead generation, documentation, permitting, and installation. Before the redesign, operations were fragmented across 5 separate platforms.
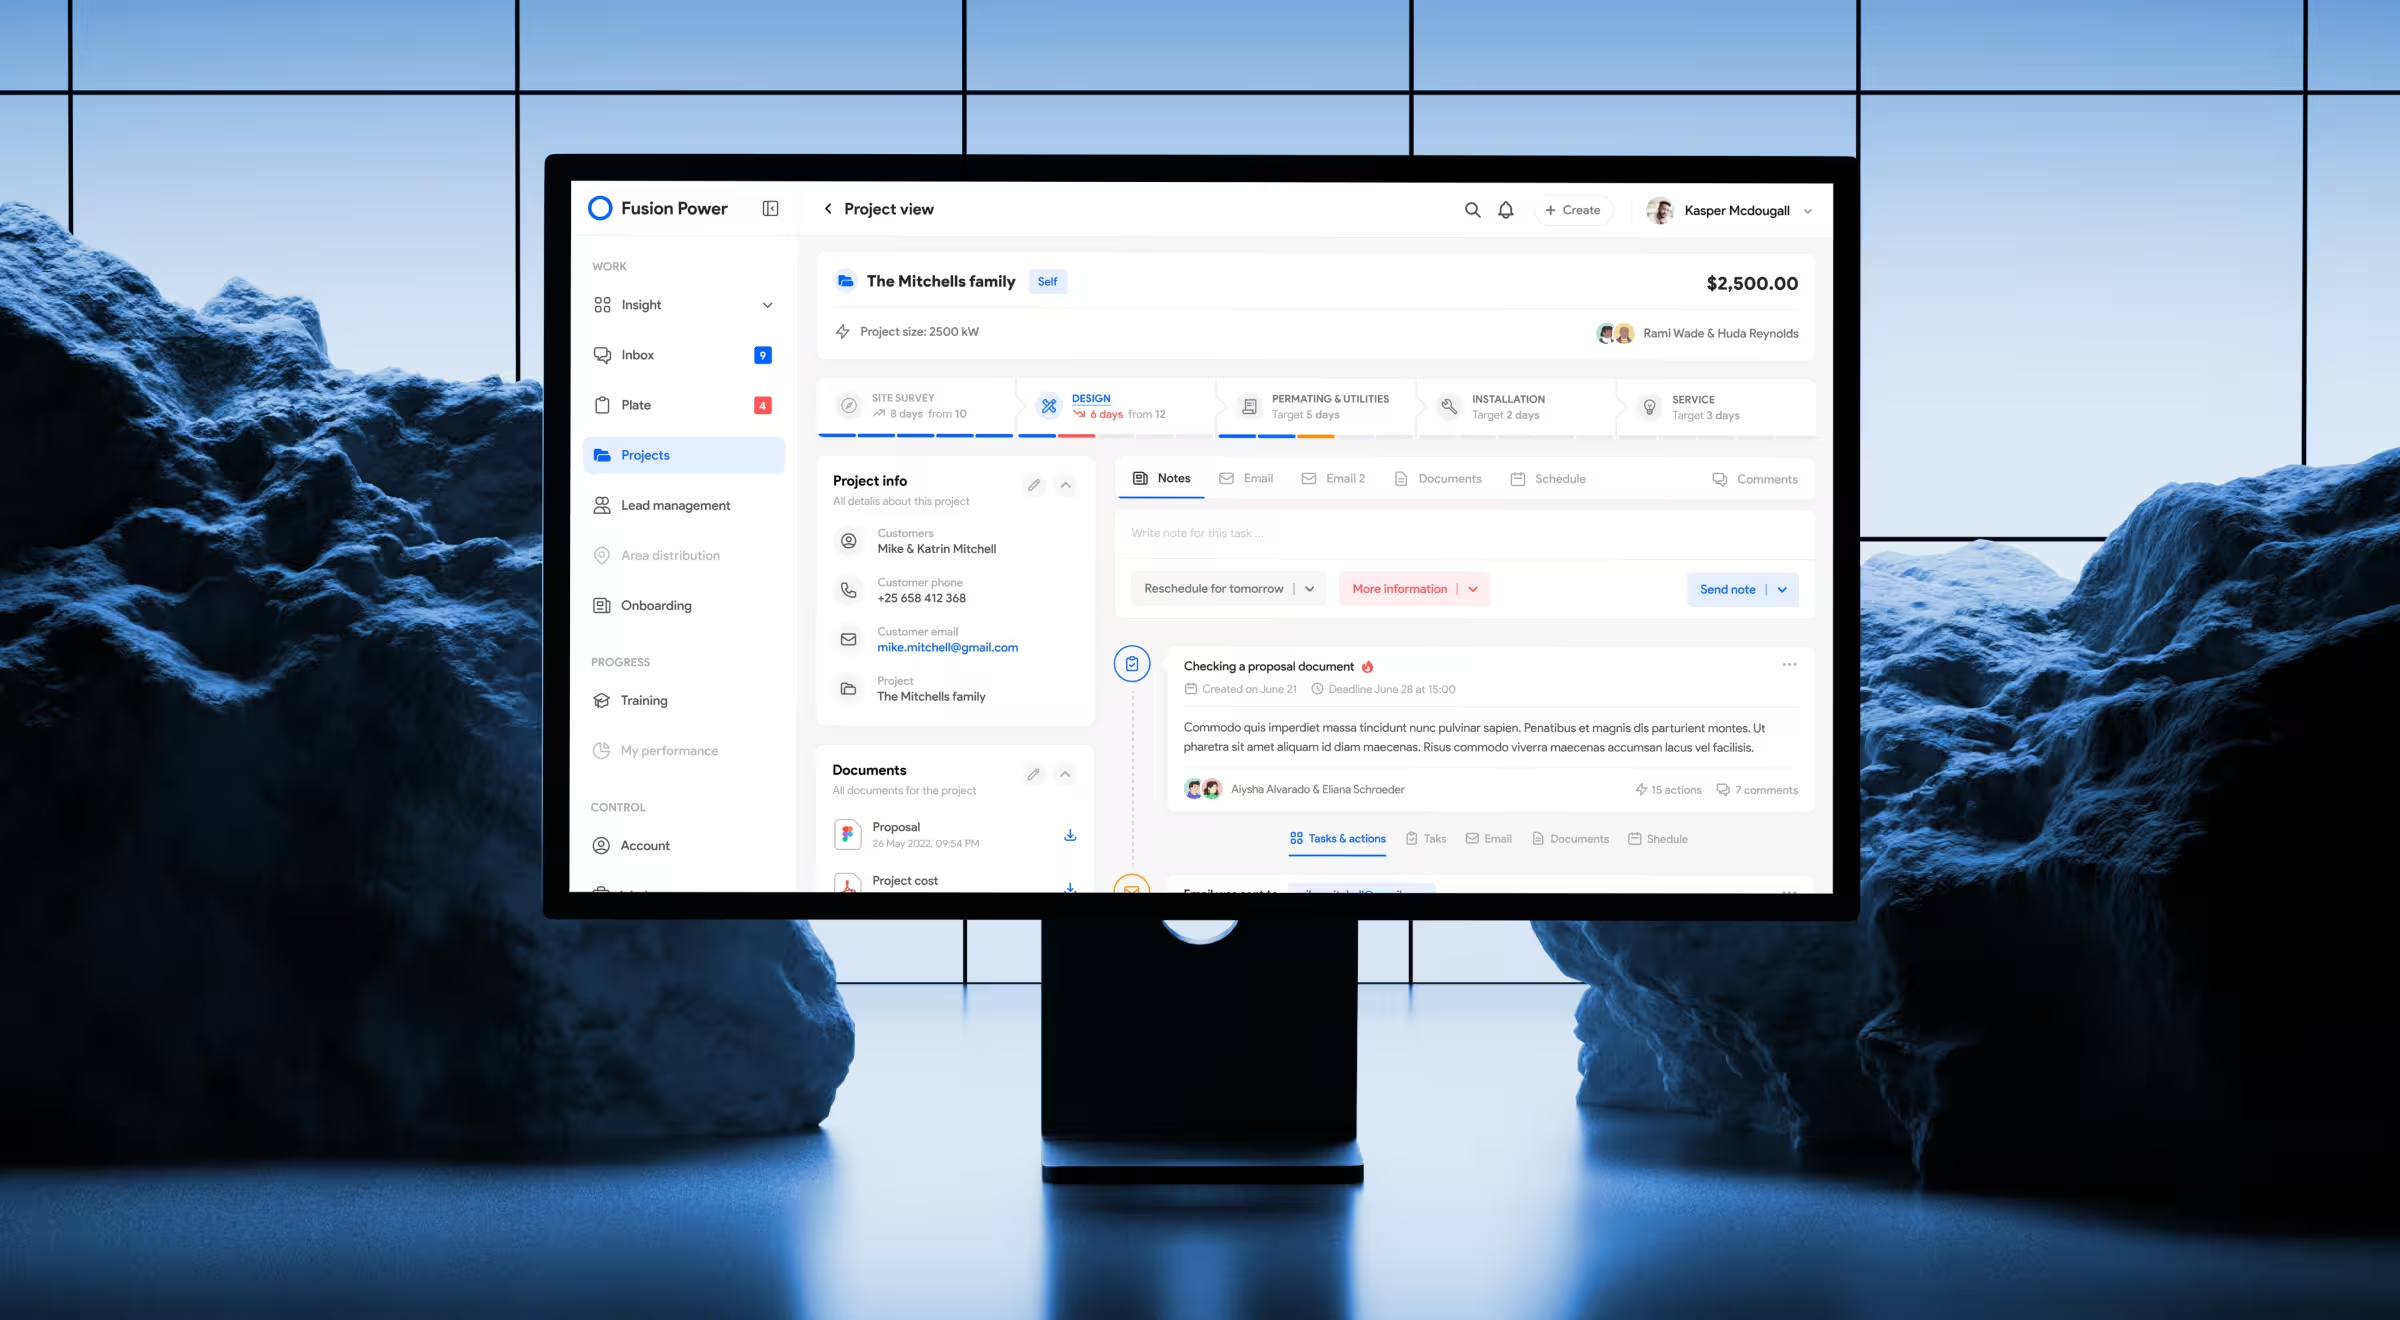
Lazarev.agency consolidated all operational stages into a unified platform. The system integrated onboarding and training modules, task management based on priority/geography, real-time project tracking, and a centralized communication inbox. Departments could now monitor progress on a single page.
Results of the UX redesign:
- 2× increase in the number of clients served daily
- 2.4 hours of daily work time saved through streamlined handoffs
8. Customer acquisition
📈 How it relates to business ROI: Customer acquisition shows how effectively marketing spend converts into revenue-generating users. When UX clarifies value and shortens decision paths, conversion increases, and cost per acquisition decreases.
✅ What a positive shift in this metric reveals:
- Higher visitor-to-signup conversion
- Shorter time to first meaningful interaction
- Increased engagement within acquisition funnels
💼 Practical case: CoHome, a real estate co-ownership platform, partnered with us to scale its digital presence and increase market share in a competitive fractional investment space. The goal was to strengthen acquisition funnels and position the platform as a credible entry point for property co-ownership.

We developed a strategic design system with minimal visual overload to make complex investment data more digestible. The homepage was rebuilt as a performance-driven funnel to guide visitors toward exploring property options. Additionally, advanced tools like the investment calculator and referral program further reinforced engagement.
Treat UX as a performance system in itself
The impact of effective UX design is pervasive. It’s hard to put a finger on a single metric that would fully encapsulate the kind of leverage optimized user experience offers.
That said, the ROI of UX is visible when examined as part of a performance system.
UX influences acquisition efficiency, conversion strength, retention stability, operational scalability, and enterprise credibility. The logic boils down to a straightforward causal relationship: UX improvements yield financial returns.
If you need a structured evaluation of how UX impacts your business performance, get in touch for a UX consultation focused on performance modeling and ROI assessment.


.webp)


.avif)