When leadership teams review design agencies, the discussion rarely centers on visual quality. What matters is business effect and accountability.
Design is approved, paused, or scaled based on one thing: whether it moves outcomes the business actually tracks.
That is why UX ROI case studies matter. Not as showcases, but as proof.
Well-constructed cases clarify what changed, why it changed, and how value was created. Weak ones blur responsibility and leave too much open to interpretation.
This article breaks down how decision-makers should read UX ROI case studies when comparing vendors, validating claims, and reducing risk before committing to a design partnership.
Key takeaways
- UX ROI case studies exist to prove business impact. They help decision-makers evaluate agencies, compare vendors, and reduce hiring risk.
- Strong cases focus on one revenue-critical flow. Clear baselines, one primary KPI, and readable ROI logic matter more than volume.
- ROI clarity beats ROI complexity. Simple assumptions and transparent math are easier to validate than dense models.
- UX ROI includes risk reduction. Prevented rework, faster decisions, and cleaner execution compound into financial return.
- Consistency across a portfolio signals real capability. One good case shows logic; repeated patterns show a reliable partner.
What UX ROI means in agency case studies
In agency portfolios, UX ROI should read like a cause-and-effect narrative.
Not a gallery. Not a metric dump.
A credible UX ROI case makes three things explicit:
- The exact point in the product where value is created or lost
- The design intervention applied to that moment
- The measurable business outcome that followed
In simple terms, ROI can be framed as:
ROI = (incremental revenue + cost savings − cost of change) / cost of change
Design ROI becomes visible when UX removes friction from revenue-critical paths. These are the moments where hesitation turns into drop-off or commitment turns into revenue: sign-up, onboarding, pricing, checkout, configuration, renewal.
When those paths become clearer and faster, businesses see higher conversion, shorter time-to-value, lower churn, and reduced operational overhead.
“What separates strong agencies from average ones is not whether they reference benchmarks, but whether they prove impact clearly in their own work.”
{{Kirill Lazarev}}
Why UX ROI case studies often fail vendor evaluation
Most UX ROI case studies fail at the framing stage. NN/g identifies three common misconceptions that undermine ROI credibility:
- ROI must be purely financial
- ROI calculations must be perfectly accurate
- ROI must account for every variable
In reality, ROI calculations are not financial audits. They are decision tools. Their purpose is to support prioritization and investment confidence, not to remove uncertainty entirely.
For vendor evaluation, this means:
- Clear assumptions are more valuable than complex formulas
- Reasonable estimates are acceptable when baselines are explicit
- Simple, scoped ROI logic is easier to validate across agencies
This is why clean, readable ROI stories outperform dense decks filled with numbers that cannot be traced back to design decisions.
How to read UX ROI case studies
Portfolios often look similar because visuals travel better than outcomes. To separate signal from noise, use a simple lens.
What solid UX ROI evidence includes
- One defined “money moment”
Checkout, onboarding, pricing, customization, or trial start (or any other aspect, but one). - A clear baseline
A stated comparison window (often 30–90 days) with source data such as GA4, CRM, or support logs. - One primary KPI
Conversion, retention, expansion, or revenue per user supported by two or three UX signals. - Transparent math
Incremental revenue or savings shown against design cost and time frame. - Decision traceability
What was changed, why, and how findings scale beyond one screen.
Questions worth asking when reviewing a case
- Where exactly does money move in this flow?
- Is the uplift absolute or percentage-based?
- How large was the sample, and over what period?
- How was attribution handled alongside marketing or seasonality?
Red flags
- Percentages without denominators
- “Estimated revenue” without a method
- Screenshots without dates or context
- Many changes bundled together with no isolation of impact
Cases that survive this scrutiny are the ones you can compare across vendors.
UX metrics for business value
Not all UX metrics carry the same weight at decision level. Mature UX ROI case studies select metrics based on product stage and business model.
NN/g’s ROI framework reinforces that ROI starts with one UX metric measured before and after change, then translated into a business KPI leadership already tracks.
Revenue and conversion
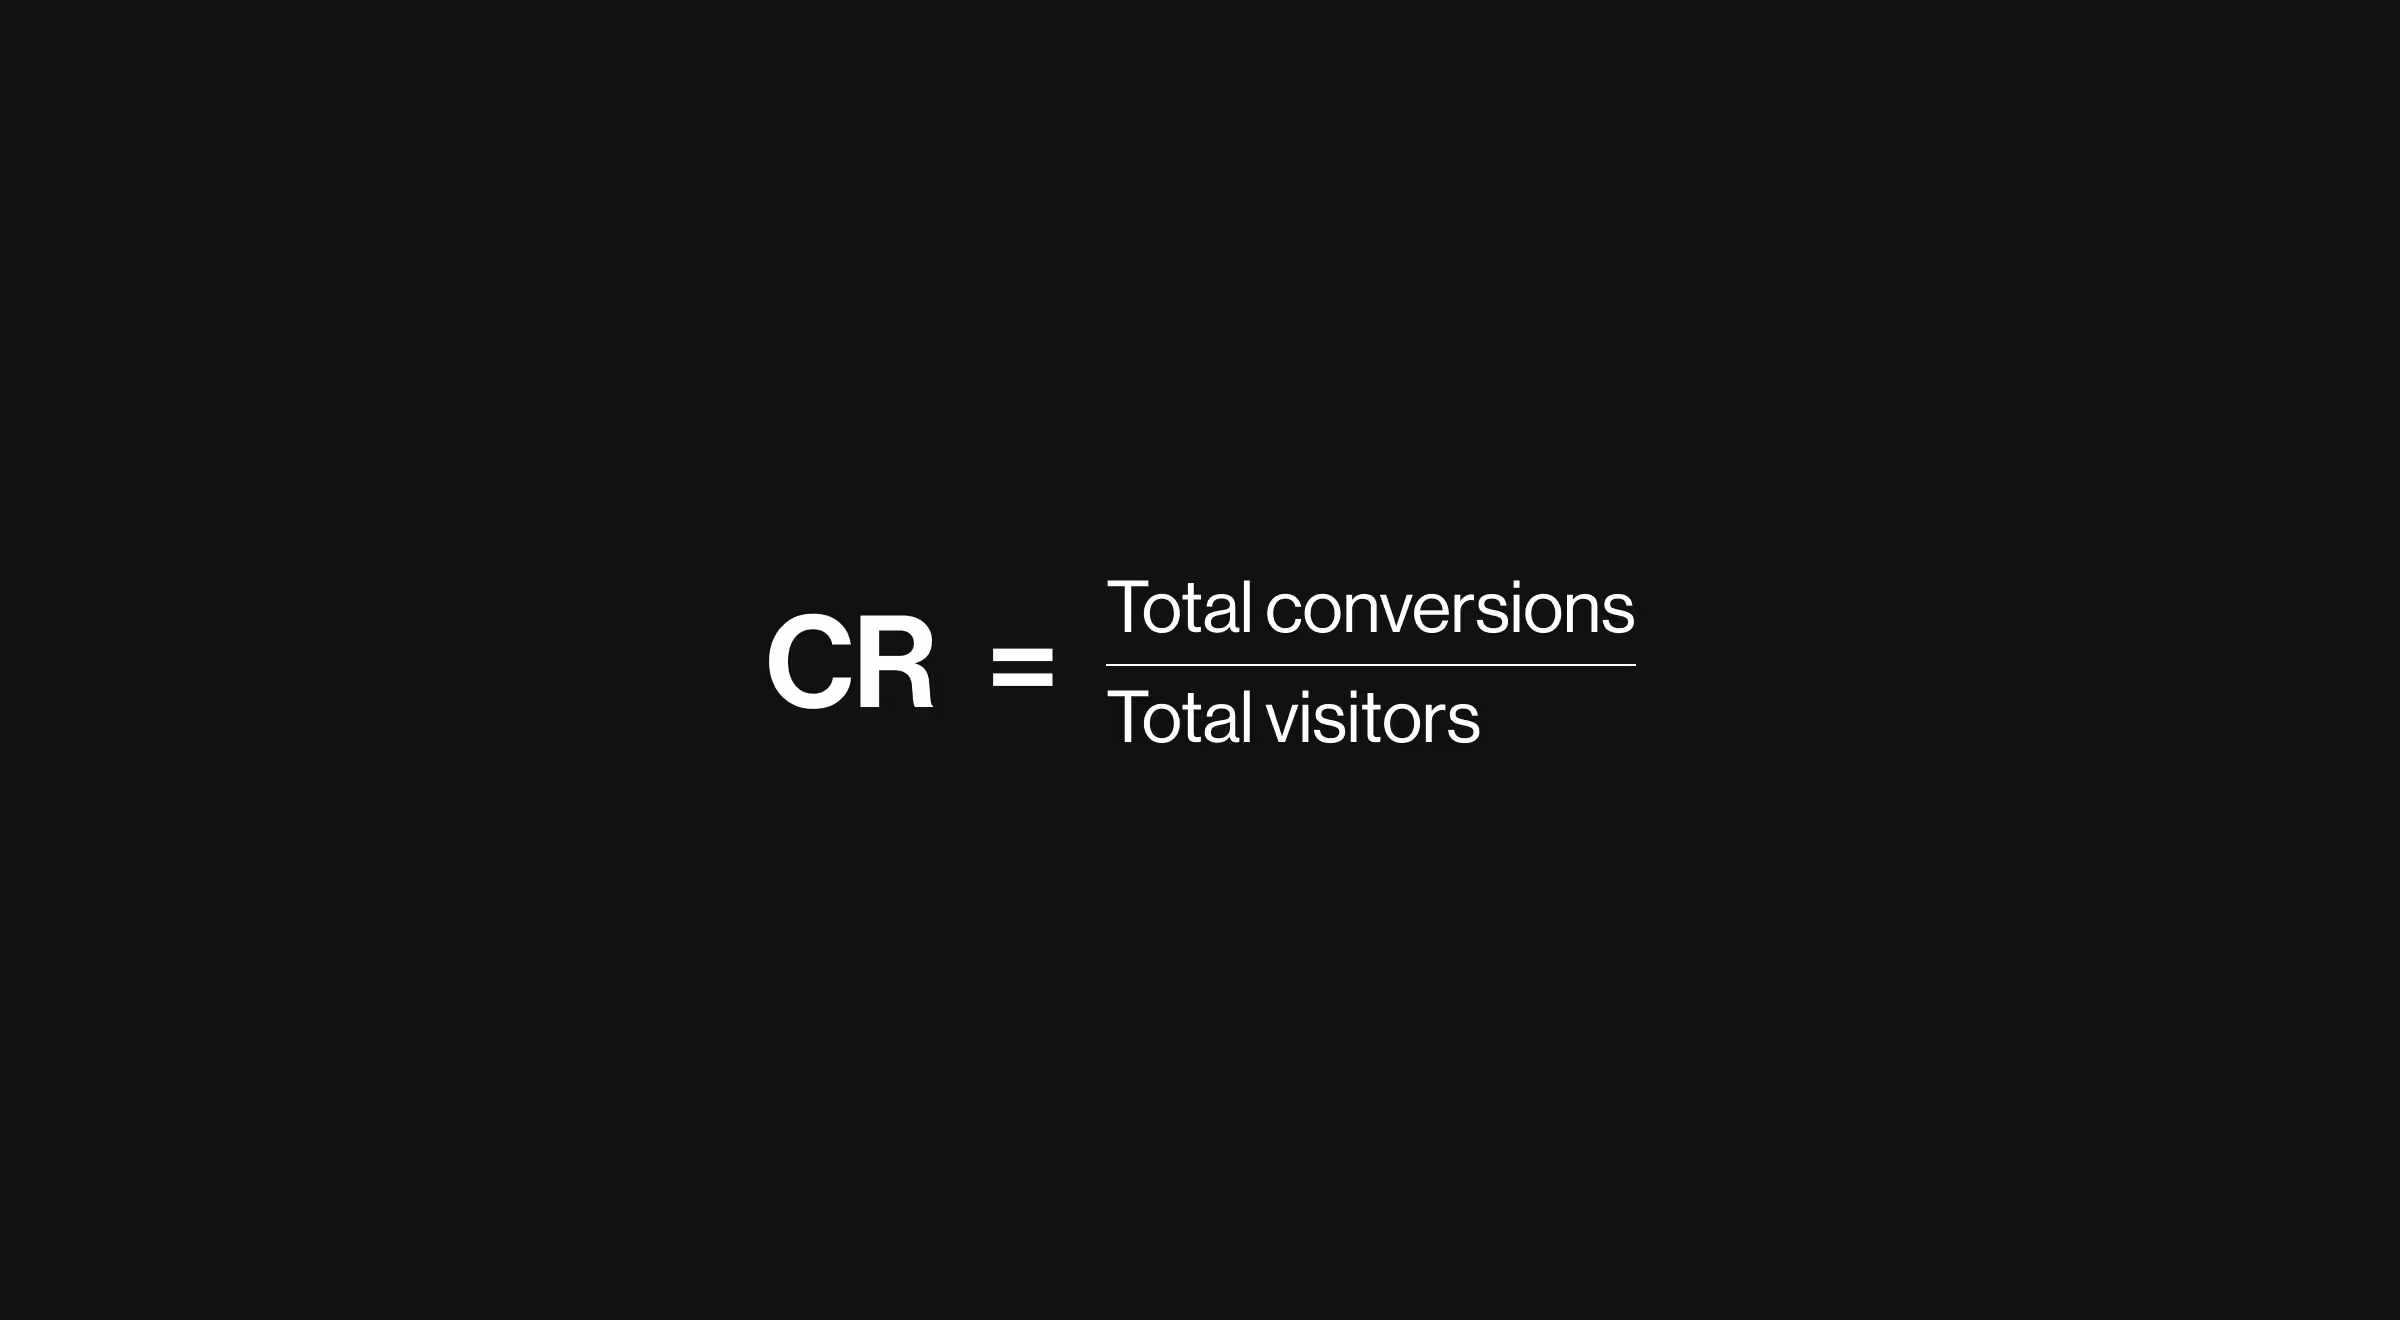
Conversion rate (CR)
Percentage of users completing a key action. Particularly relevant for pricing pages, checkout, and demo requests.
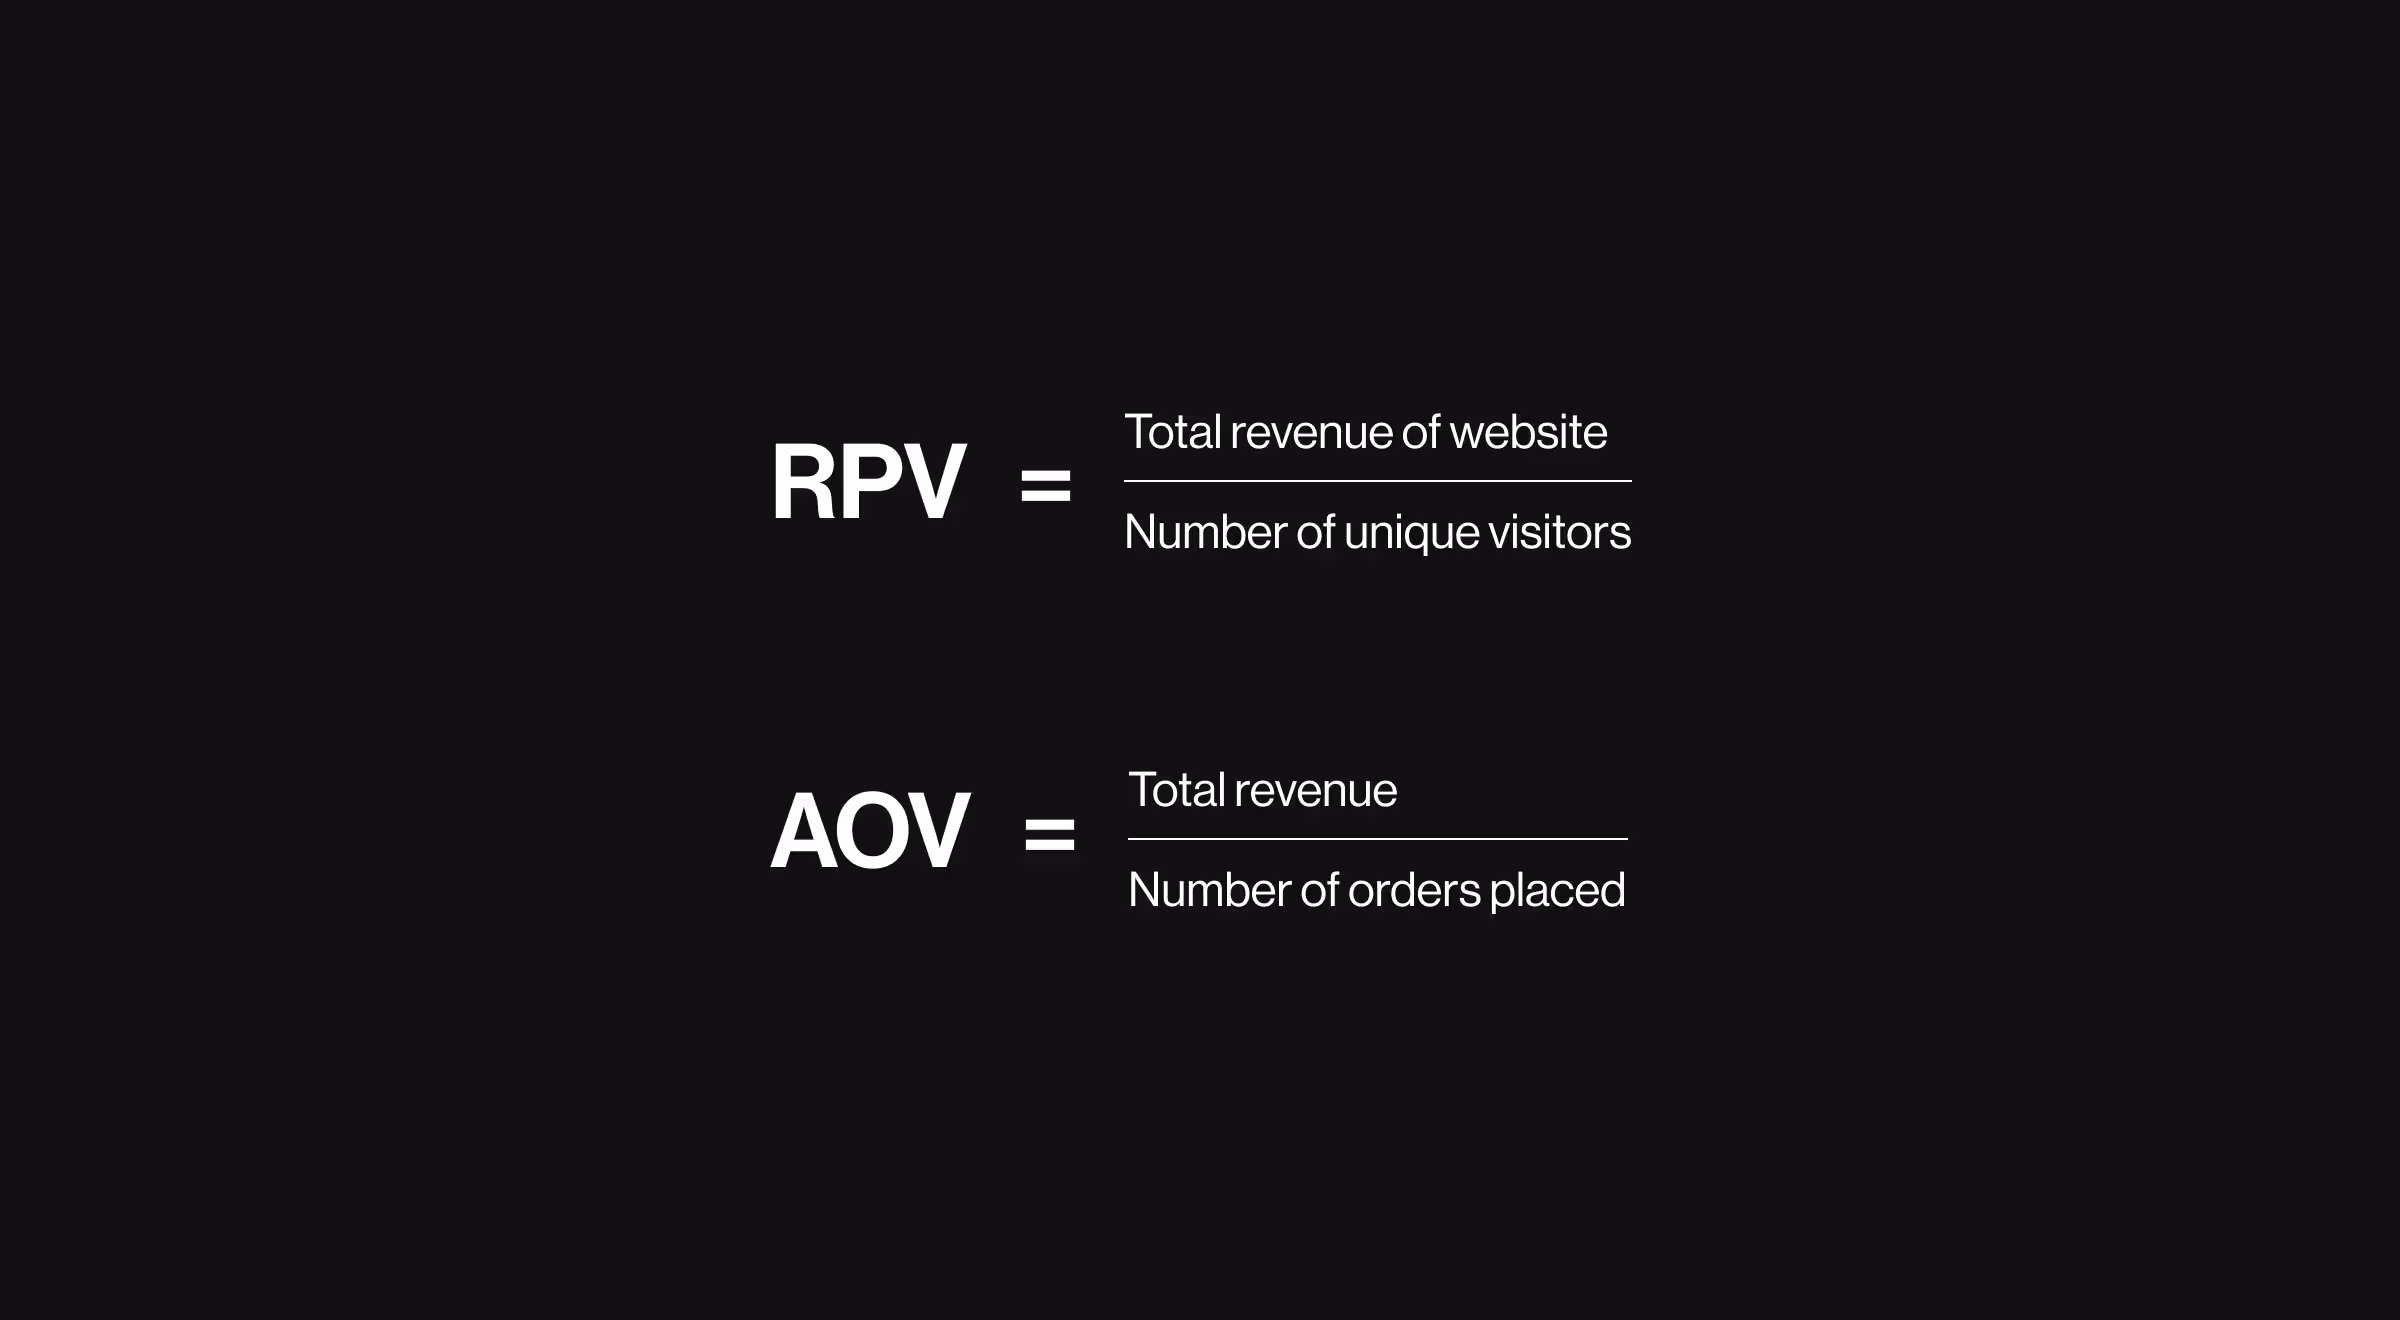
Revenue per visitor (RPV) and average order value (AOV)
Often affected by form design, clarity of options, and recommendation UX.
Retention and loyalty
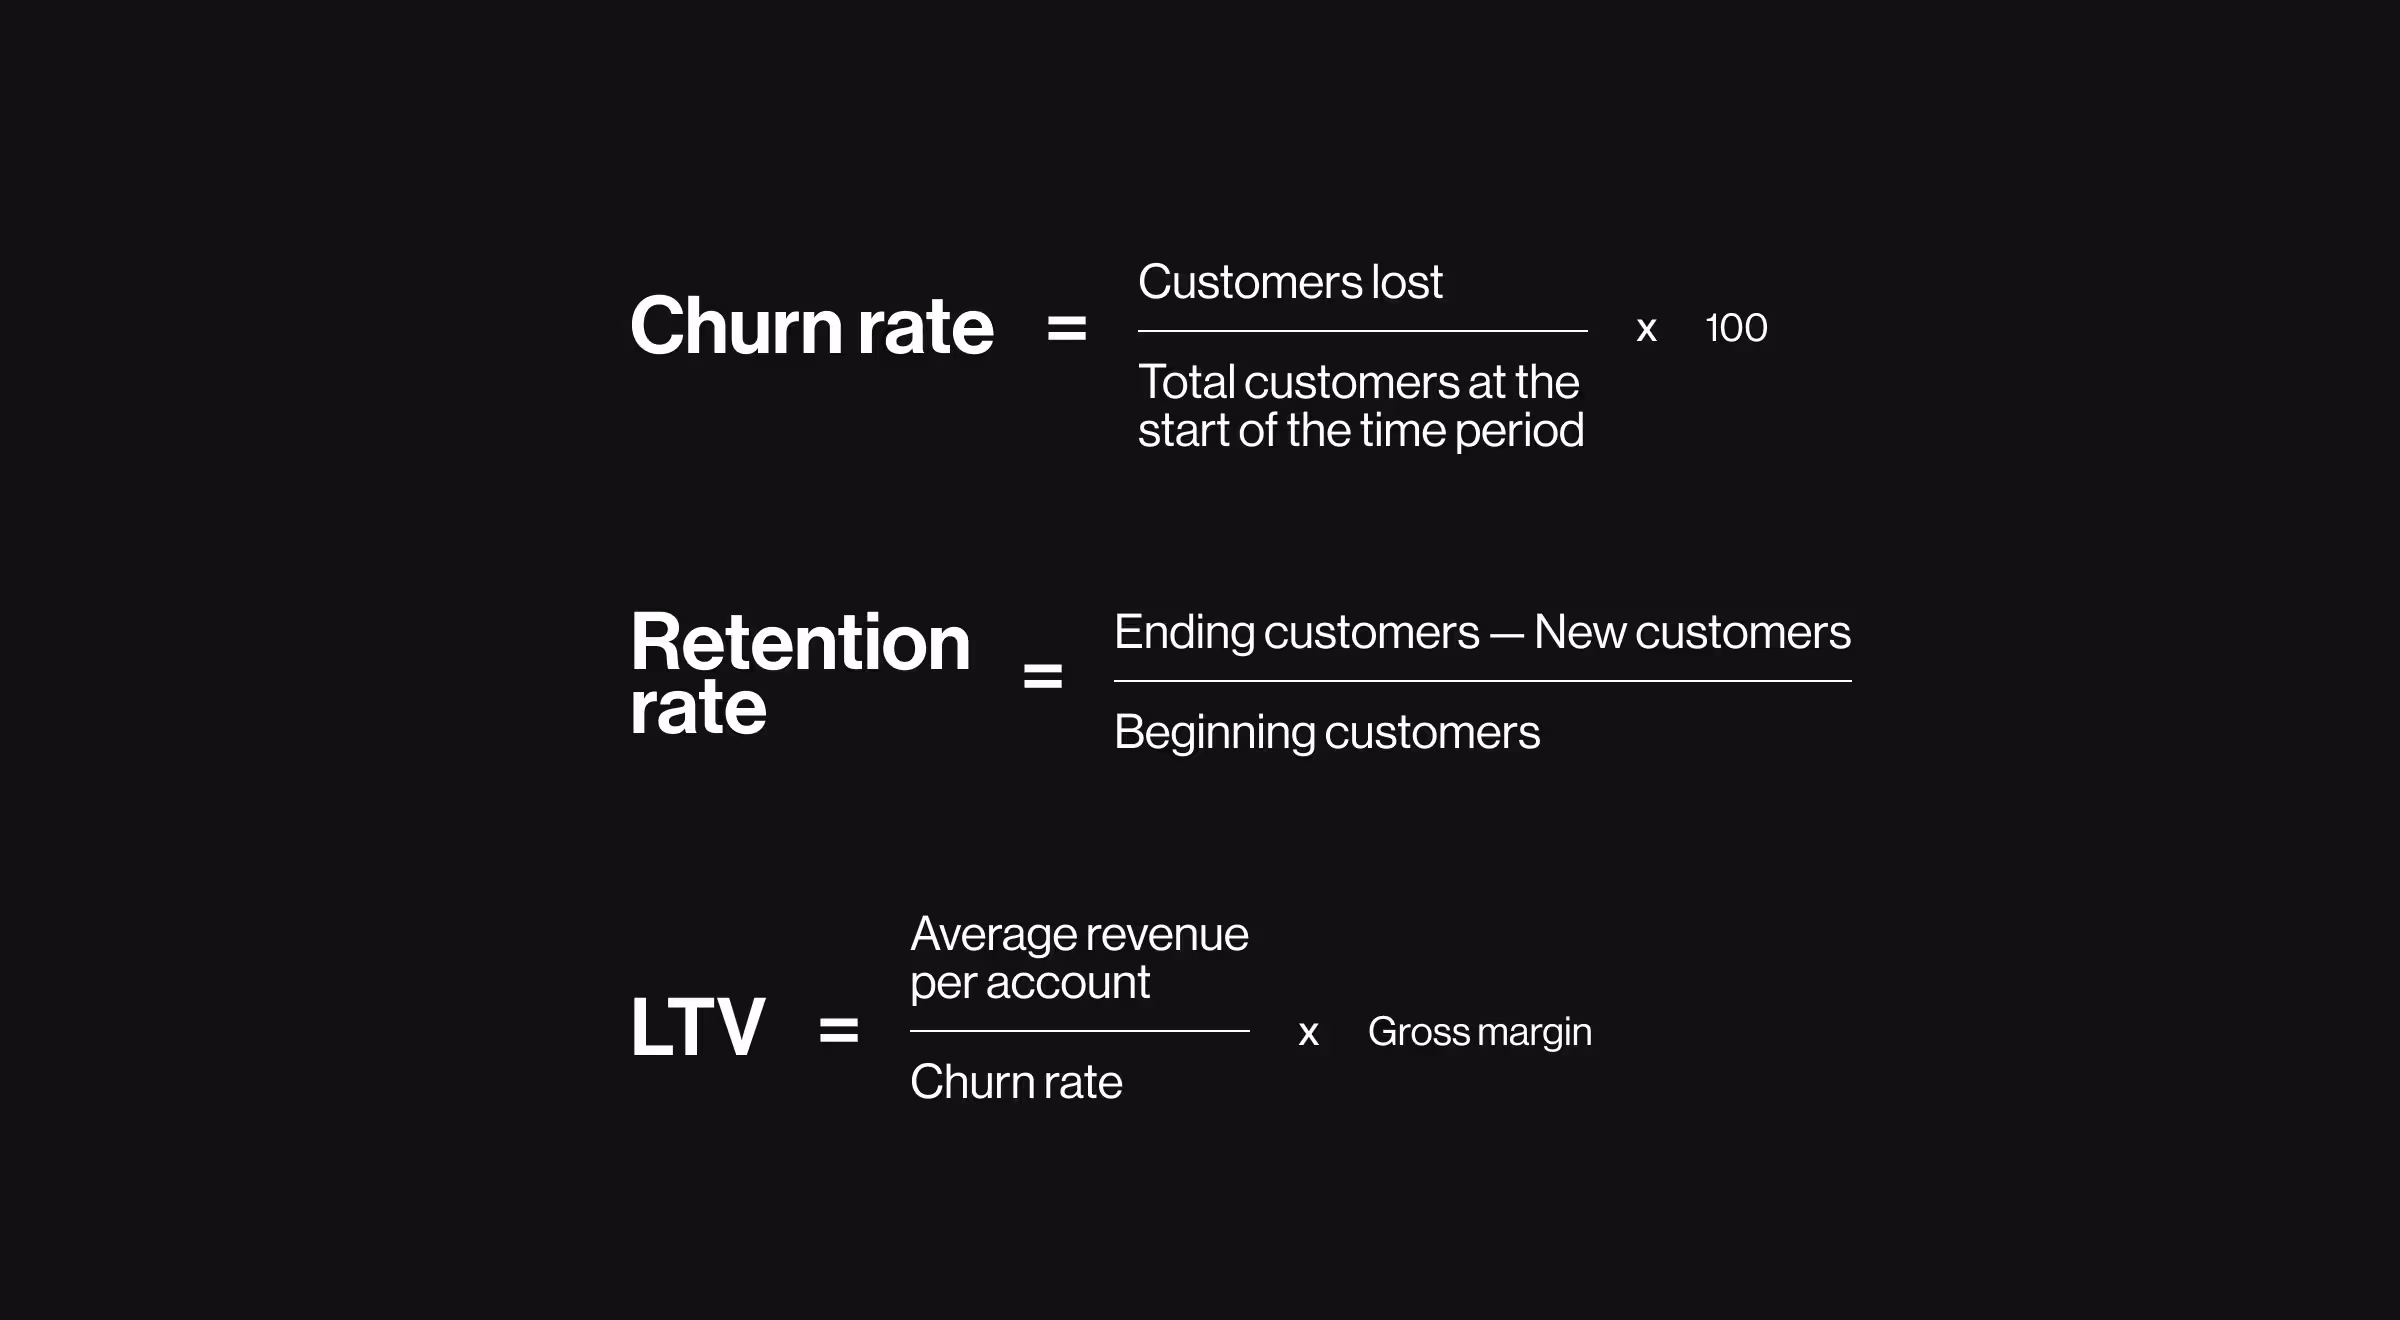
Retention and churn
Core for SaaS and subscription products, directly tied to lifetime value.
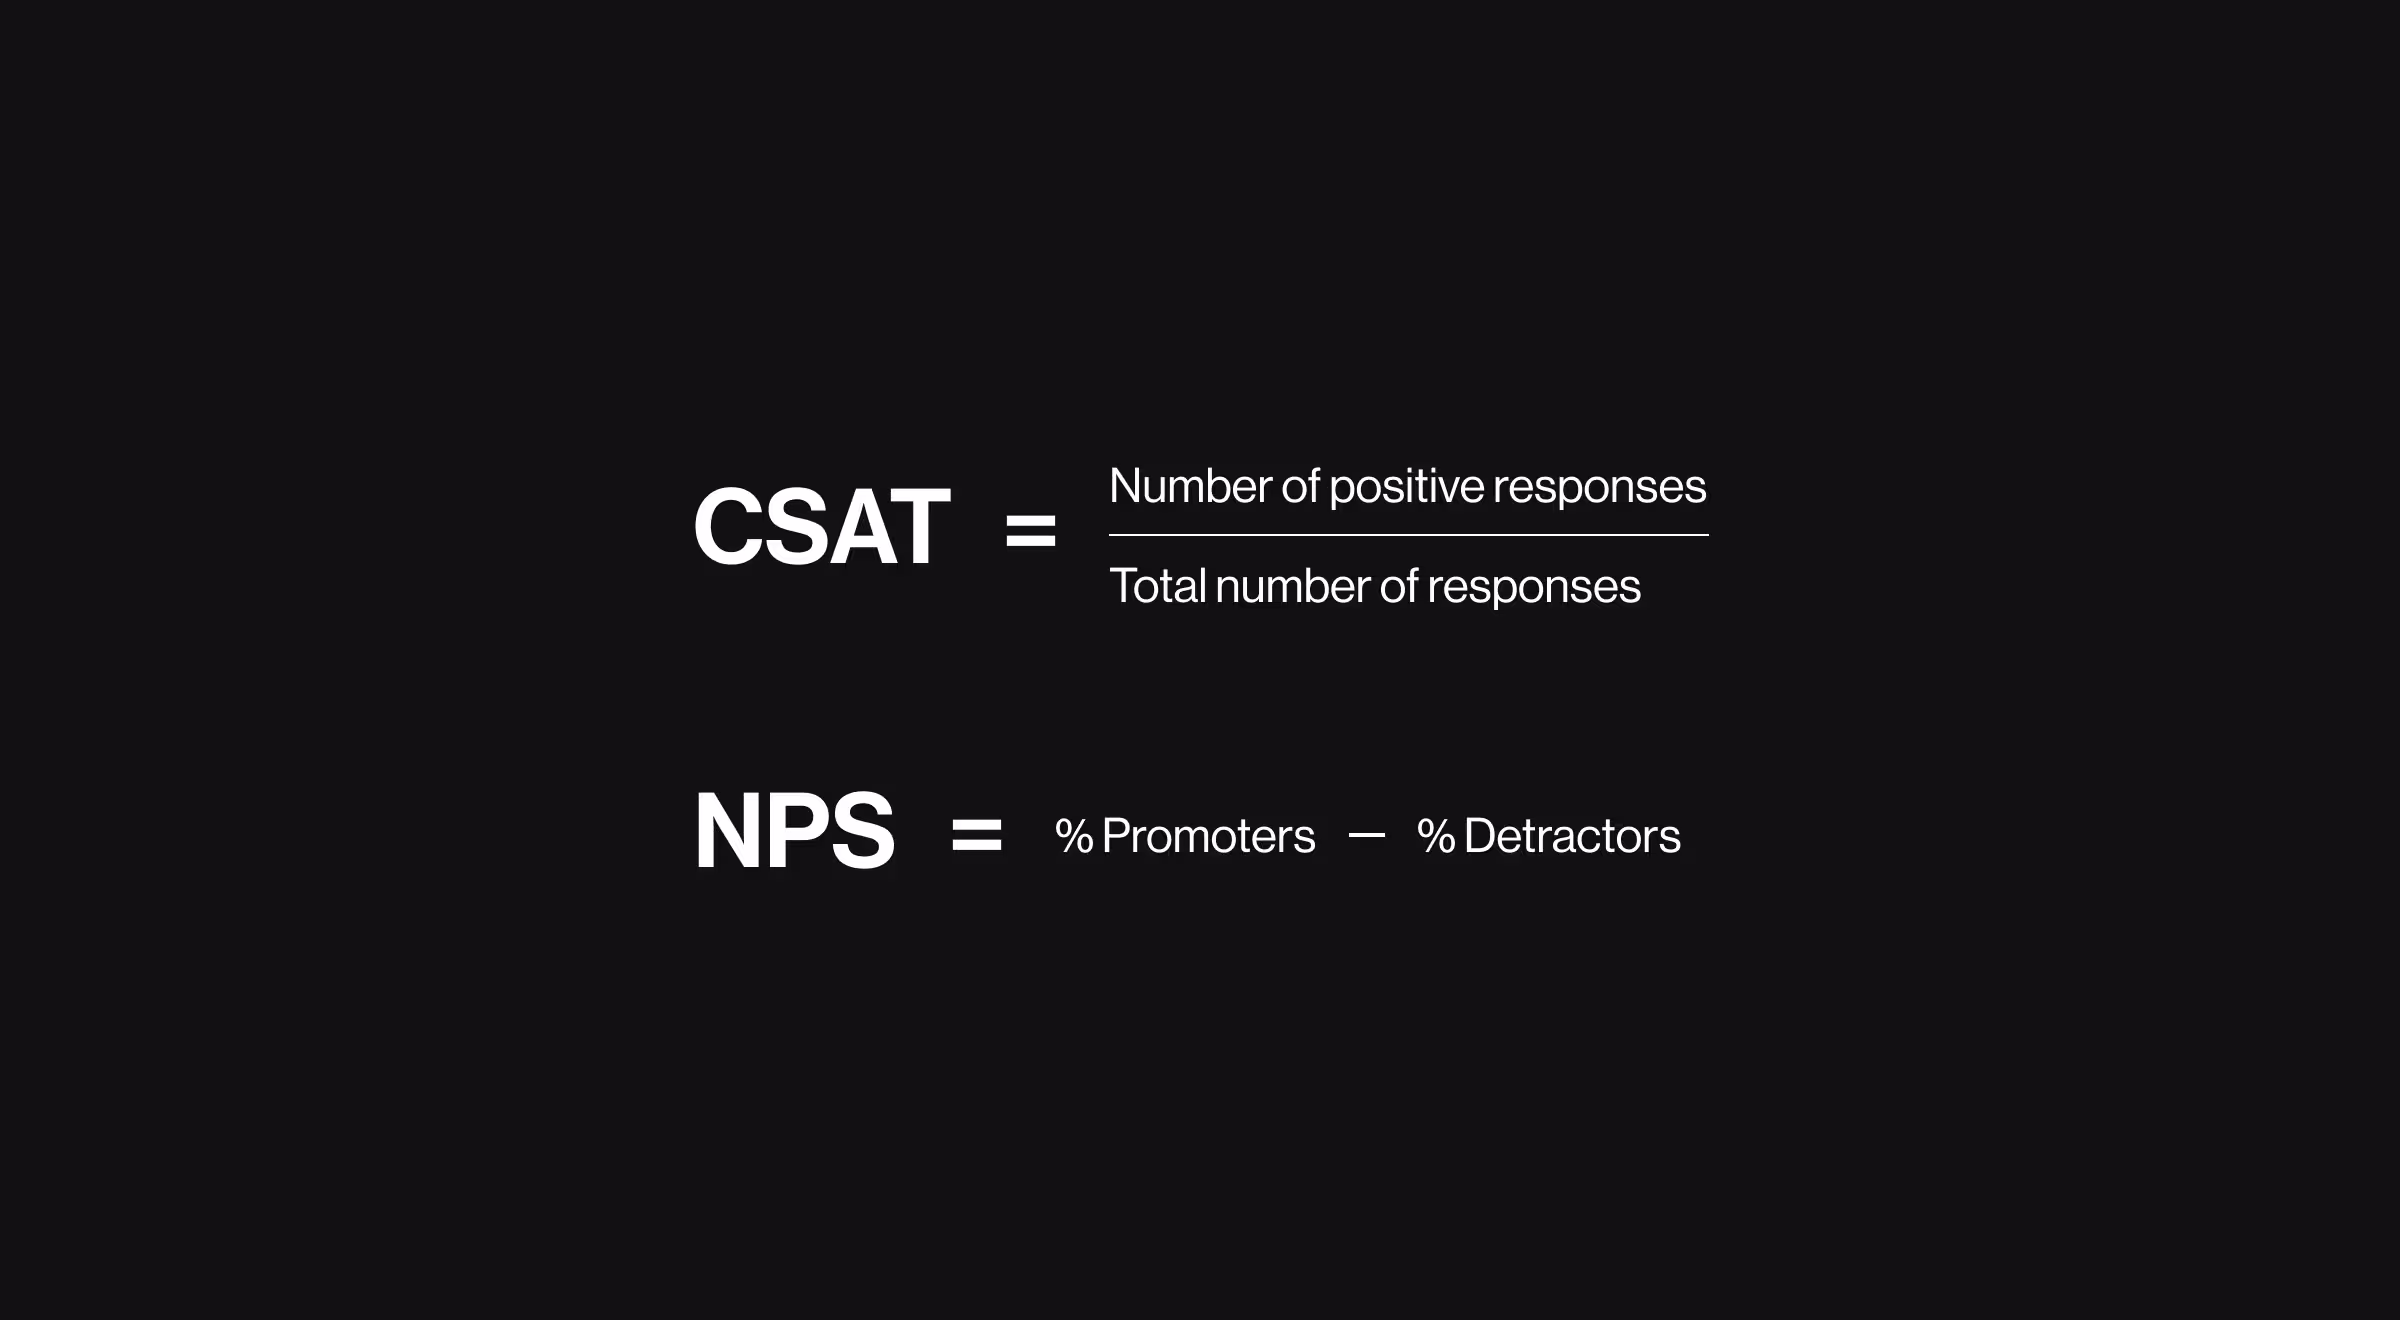
NPS and CSAT
Fast indicators of perceived value, useful when paired with behavioral data.
Usability and efficiency
System Usability Scale (SUS)
A standardized benchmark to show usability improvement across iterations.

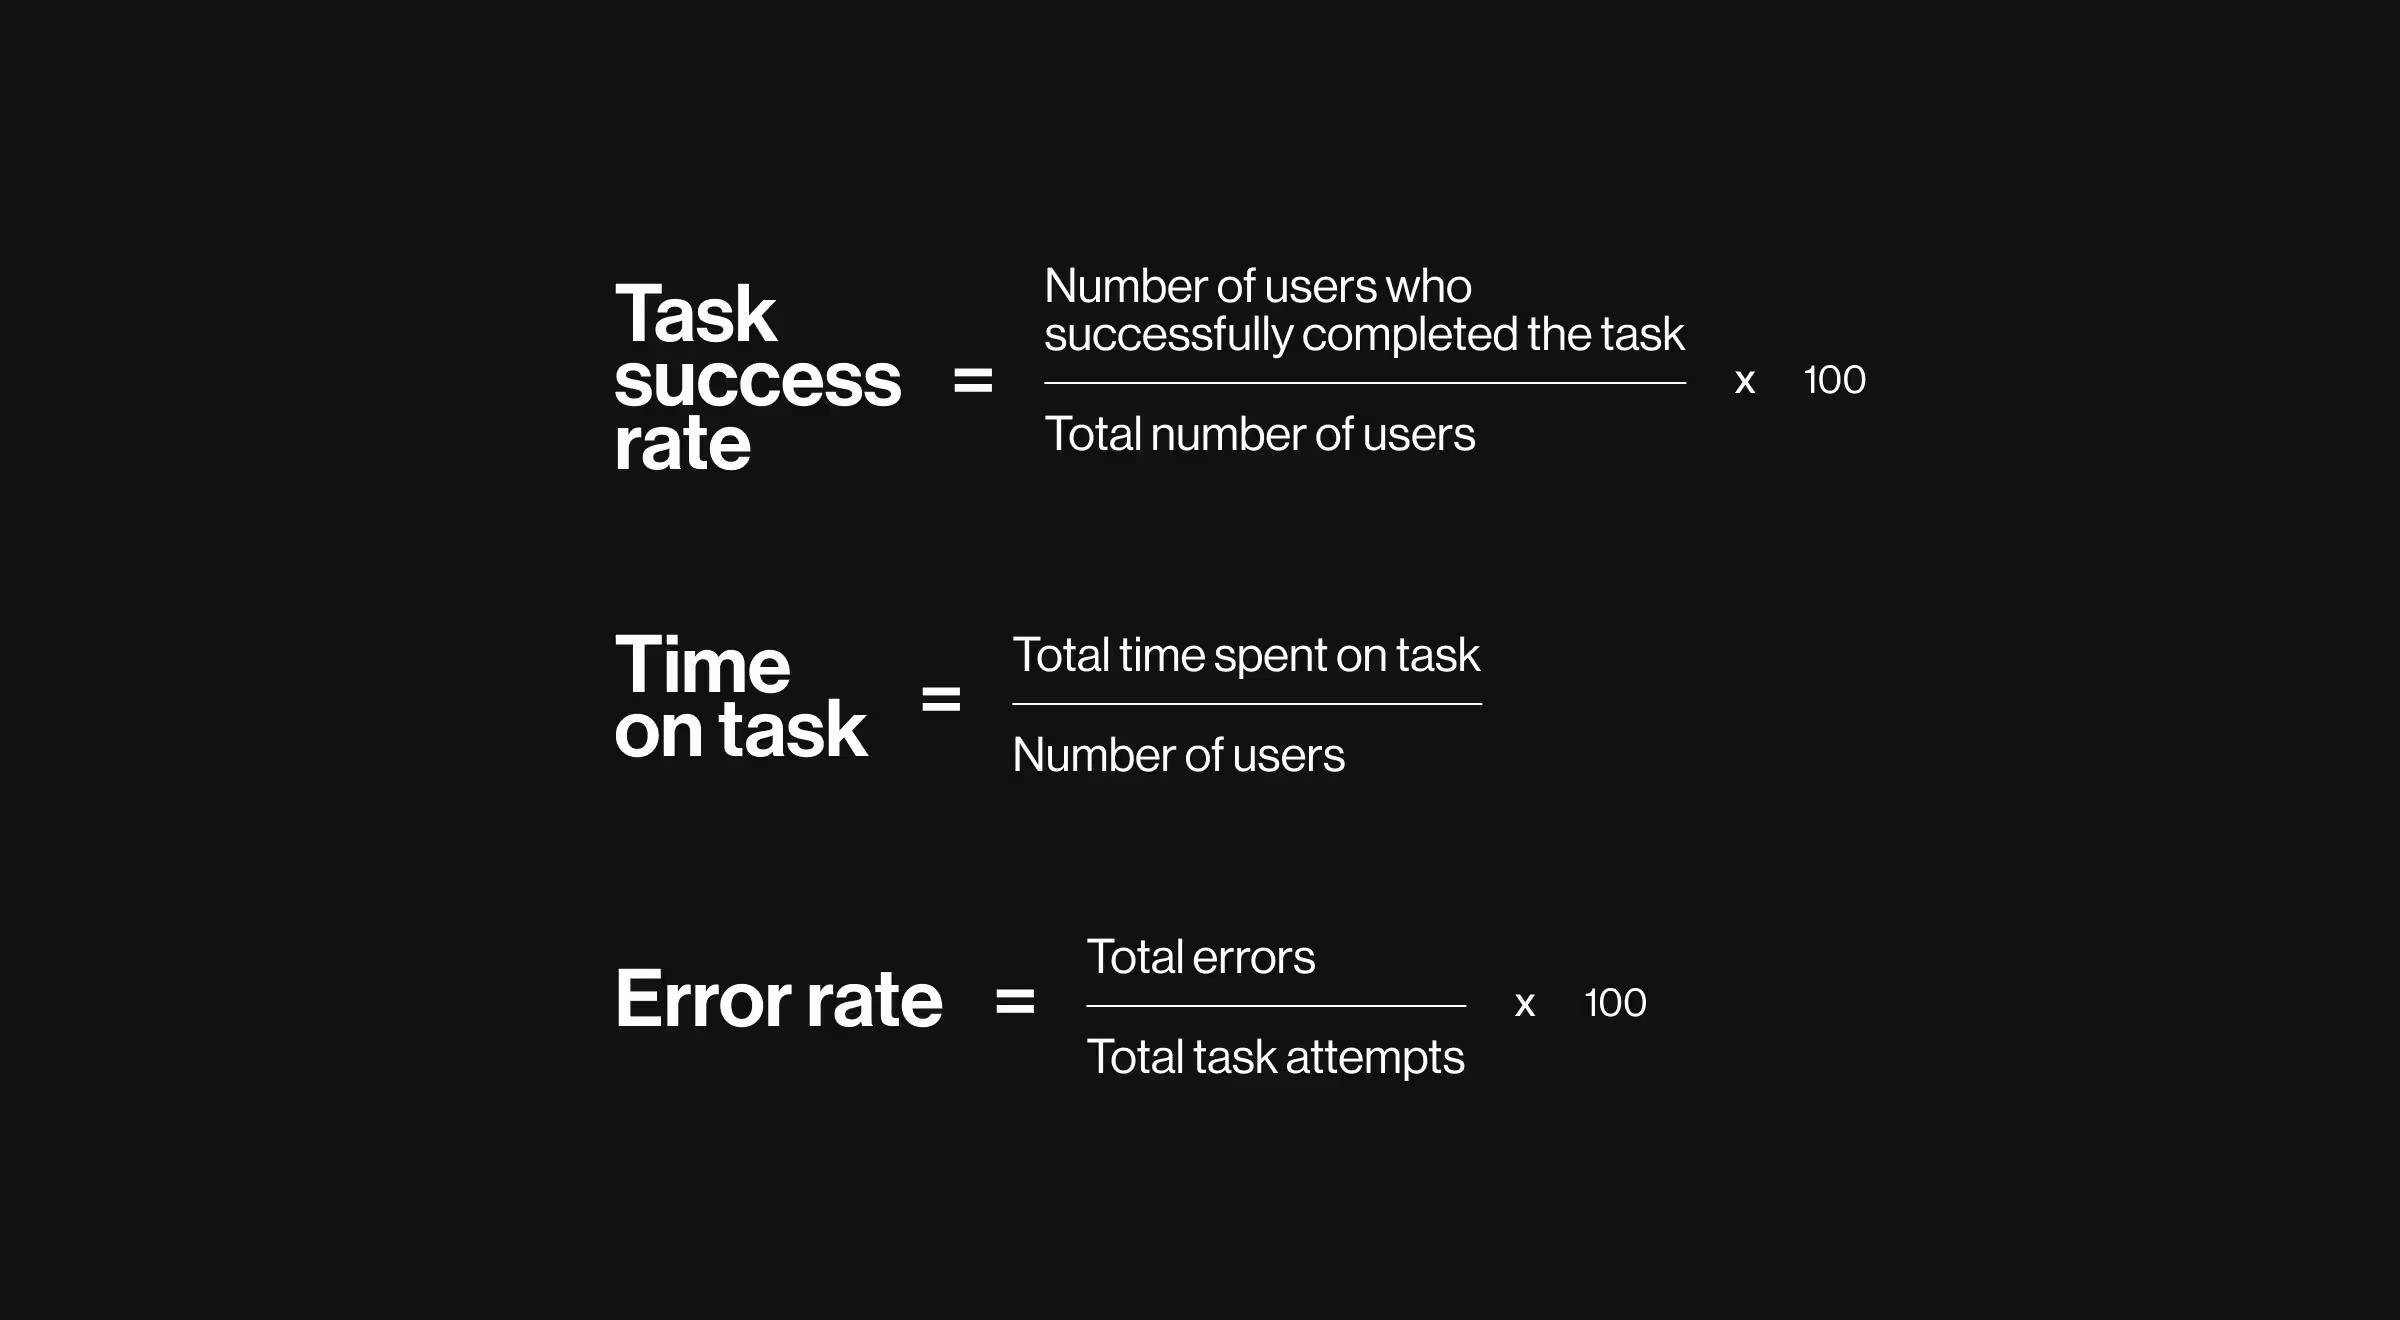
Task success, time on task, error rate
Best used to explain why conversion or retention changed.
A strong case usually anchors on one north-star KPI, supported by a small set of explanatory signals.
Consider UX ROI as risk reduction
UX ROI should not appear immediately as revenue assets. Maze frames UX and research ROI as risk reduction and decision acceleration, which compounds into financial return over time.
Due to Maze, signals of mature ROI thinking in case studies include:
- Research preventing rework or misaligned features
- Assumptions validated before development
- Faster iteration cycles tied to measurable outcomes
“Agencies that document this logic demonstrate that UX decisions reduce downstream cost and uncertainty.”
{{Kirill Lazarev}}
UX ROI formulas decision-makers should expect to see
You don’t need complex financial modeling to validate design impact. Clean inputs matter more than elaborate math.
Common calculations include:
- Conversion uplift × average value × traffic volume
- Reduced support tickets × cost per ticket
- Time saved per task × hourly cost × frequency
- Retention uplift × customer lifetime value
What matters is whether the agency documents assumptions, sources, and time frames. That’s what makes the numbers defensible in leadership discussions.
What strong UX ROI deliverables look like
ROI-driven agencies like Lazarev.agency don’t stop at screens. Their deliverables usually include:
- Before/after performance snapshots
- Experiment or rollout summaries
- Documented UX decisions tied to KPIs
- Post-launch measurement plans
- Clear ownership of data sources
These artifacts signal that design is treated as a business lever.
Real-world example: We Build Memories case study
Client
We Build Memories, a top-5 Etsy seller, building a B2B e-commerce platform for custom baby clothing.
Business problem
Outdated branding and a complex customization flow limited engagement and conversion. The product also lacked a clear landing page to communicate value.
Design work
- Brand modernization
- A sales-focused landing page with structured value messaging, CTAs, a profit calculator, and social proof
- A transparent customization flow with instant previews
- Simplified order management and invoicing
Measured outcomes
- +20% conversion rate in the customization flow
- +25% time on site
- +15% revenue
- −30% churn
We Build Memories UX case works because it isolates one revenue-critical flow, shows before/after impact, and keeps the math readable. Consider it as an example of authoritative case studies worth attention.
🔍 We Build Memories is one example. The Lazarev.agency portfolio includes diverse UX case studies documented with clear business goals, measured impact, and ROI logic.
How to compare agencies using UX ROI evidence
When evaluating vendors, treat UX ROI case studies as decision tools:
- Look for repeated patterns across cases, not one-off wins
- Check whether metrics align with your business model
- Assess how clearly agencies explain causality
- Compare reporting rigor, not just outcomes
This approach reduces guesswork and clarifies what kind of partner you’re hiring.
🔍 Strong ROI evidence matters. So does how an agency works day to day. This guide covers what to assess beyond case studies when hiring a design partner.
Vendor-evaluation checklist: how to assess UX ROI case studies
Use this checklist when reviewing design agency portfolios or shortlisting vendors.
If most boxes stay unchecked, the case study does not prove ROI.
1. Business context & scope
☐ A single revenue-critical flow is clearly defined (checkout, onboarding, pricing, configuration, renewal)
☐ The business goal is stated in measurable terms
☐ The product type and maturity level are explicit (B2B, SaaS, marketplace, ecommerce)
2. Baselines & data sources
☐ A baseline time window is specified (e.g., previous 30–90 days)
☐ Data sources are named (GA4, CRM, support logs, experiments)
☐ Comparisons are apples-to-apples (same traffic mix, device, geo, audience)
3. Metrics to consider
☐ One primary KPI tied directly to business value (conversion, retention, expansion, revenue per user)
☐ 2–3 supporting UX performance metrics that explain the outcome (errors, task success, SUS, CSAT)
☐ All metrics are defined clearly
4. Causality & design decisions
☐ UX hypotheses are stated before results
☐ Key design changes are documented
☐ The case explains why those changes affected user behavior
5. ROI logic & math
☐ ROI is calculated using real inputs
☐ Timeframe for return is stated
☐ Cost of change is acknowledged (design, build, rollout)
6. Evidence quality
☐ Results are tied to specific screens or flows
☐ Sample size and rollout method are mentioned
☐ Attribution is addressed (seasonality, marketing overlap)
7. Transferability
☐ The agency explains how insights scale to other flows
☐ The process looks repeatable
☐ Deliverables show measurement discipline beyond visuals
A strong vendor passes at least 5 of 7 sections with no major red flags.
Final takeaway
Once design agencies are shortlisted, the biggest risk becomes choosing based on surface-level portfolios.
Before committing, decision-makers should have clarity on:
- Which flow will generate measurable return first
- What metrics will validate success within a defined window
- How impact will be evaluated after launch
ROI framing works best when it supports better decisions, not when it aims for theoretical precision.
At Lazarev.agency, UX work is scoped around a single business-critical flow, with KPIs defined upfront and outcomes measured in business terms.
For teams that want a grounded ROI narrative before signing a design contract, a flow-level UX assessment provides:
- A prioritized opportunity with clear upside
- A measurement framework aligned with the business model
- An ROI story leadership can review with confidence
No speculative redesigns.
No decorative metrics.
Only work that stands up after launch.
Let’s talk.


.webp)


.avif)