.avif)
Many product teams fall into the trap of categorizing design as a creative service: something to fine-tune interfaces and make them more pleasant to use. That’s why, when budgets tighten, design is treated as discretionary spending, positioned far from core investment targets.
This assumption leads to a strategic blind spot.
In digital products, design is in charge of a lot. It determines how customers understand your product positioning and how quickly they acknowledge its value. And it’s exactly at these design-defined moments that the revenue is either created or lost for good.
In this article, we debunk the common myth concerning design value, examine the revenue metrics design influences, and illustrate these dynamics through real product cases from our portfolio.
Key takeaways
- Design is not a cost center. It’s a strategic investment with high returns. Design decides how efficiently marketing converts attention into revenue.
- Design multiplies growth investments. Strong UX improves acquisition efficiency, retention, and revenue per user simultaneously.
- Elaborate products thrive with design discipline. Without structured interfaces, even powerful products lose users over time.
Debunking the design cost myth
“Over the years, I’ve watched many founders hesitate to invest in design because they see it as a cost center. Yet time and again, the most expensive decision they make is underinvesting in it. The cost of poor design compounds through wasted marketing budgets, products users abandon, and opportunities that never convert into revenue.”
{{Kirill Lazarev}}
A scarcity mindset around design spending often comes from how organizations account for it. In many companies, design sits low in the hierarchy of business priorities — it’s usually a line item under marketing or product development. That accounting structure frames design as a surface-level concern.
In reality, design shapes fundamental economic mechanics inside digital products. It influences how users convert, how efficiently companies acquire customers, how long those customers stay, and ultimately how much value they bring to your business over time.
Data insight: McKinsey reports that companies focused on design outperform industry peers with 32% higher revenue growth and 56% higher shareholder returns over a five-year period. Meanwhile, Forrester has found that well-designed user experiences can increase conversion rates by up to 400%.
So, a logical question arises: why do so many companies still treat design as a secondary investment?
The problem stems from a simple accounting illusion — confusing a cost with an investment. A cost is money spent without multiplying the return. An investment is capital that amplifies future performance.
Design behaves like the latter. It affects:
- how efficiently marketing converts traffic into customers
- how easily users adopt new product features
- how quickly customers reach value after onboarding
When design performs poorly, the consequences appear elsewhere in the business. Marketing budgets inflate to compensate for low conversion rates. Customer support teams handle confused users. Product teams struggle with feature adoption. The financial impact is real, but it is often misattributed.
Design investment is a revenue multiplier
The most optimal way to understand design is as a multiplier acting on other investments within the business. It’s a mediator for product growth across metrics.
Marketing budgets and product development all depend on the product experience to produce results. Design determines how effectively these investments translate into customer action.
Three relationships illustrate this dynamic.
1. Marketing budget × design quality = customer acquisition rate
Marketing welcomes visitors to explore a product environment. Design determines whether those visitors stay and convert.
💡 Example: Consider two companies, each spending $1 million on marketing. Both campaigns drive the same amount of traffic. But:
- Company A converts visitors at 2%
- Company B converts visitors at 5%
Company B acquires 2.5× as many customers for the same marketing spend.
From a financial perspective, Company B does not have a marketing advantage. It has a product experience advantage.
Design role: Visitors arrive because marketing did its job. What happens next depends on how quickly the interface communicates value. If the product environment helps users understand the offer and progress intuitively toward action, traffic converts. If it doesn’t, companies compensate by buying more traffic.
2. Product complexity × design quality = user retention
As products evolve, usability becomes increasingly critical. Complex systems require thoughtful information architecture and intuitive workflows.
Without these elements, feature-rich products overwhelm users. As our experience shows, retention depends less on the number of features a product offers and more on how easily users can navigate those features to pursue their goals.
💡 Example: Take Accern’s AI research platform, Rhea.
.avif)
A 100% chat-based interface would force analysts to manage research through long text threads. To sidestep this, our team designed a hybrid interface combining natural language prompts with widgets and structured data panels, allowing users to analyze information and interact with the AI at the same time.
The redesigned product helped propel Accern from Series B to an eight-figure acquisition and supported $40M+ raised during the partnership.
Design role: Every mature product accumulates features and workflows. Without a structured UI, that accumulation becomes cognitive overload. Users may recognize the product’s potential, but interacting with it becomes work.
🔍 Explore our hub for a more comprehensive coverage of how to increase retention with strategic UX.
3. Conversion rate × design optimization = revenue per user
Small changes in conversion rates can significantly affect revenue performance, particularly in products operating at scale.
💡 Example: Consider a product receiving 100,000 monthly visitors with an average order value of $100.
- At a 2% conversion rate, monthly revenue equals $200,000.
- At a 3% conversion rate, monthly revenue increases to $300,000.
A single percentage-point improvement generates $1.2 million in additional annual revenue without increasing marketing spend.
Design role: These improvements arise from clearer product messaging, simplified decision paths, and stronger trust signals — all outcomes shaped by design.
🔍 Learn more about how to measure the ROI of UX design for your product.
How design impacts revenue metrics: insights from Lazarev.agency’s portfolio
The economic influence of design becomes clearer when observed inside actual product environments. Across industries from enterprise SaaS to Web3 infrastructure interface decisions consistently affect the way revenue flows through a business.
Three mechanisms appear most frequently: conversion, acquisition, and retention.
1. Conversion rate optimization
Conversion rate shows how effectively a product turns visitors into customers or users. It reflects the clarity of the decision path within the interface.
Well-structured interfaces guide users through a sequence of decisions with minimal uncertainty. Information hierarchy, product comparison tools, visual trust signals, and simplified checkout processes all strengthen this clarity.
When these elements are absent, users hesitate or abandon the process entirely.
Practical case # 1: Priority Tire
Priority Tire, a leading U.S. online tire retailer, faced a unique challenge. Tire purchasing requires navigating multiple technical parameters like size, vehicle compatibility, and driving conditions. Yet most customers lack expertise in these areas.
.avif)
Our redesign focused on making complex product selection intuitive through refined search and advanced filtering options.
Key improvements included:
- redesigned navigation and search flows
- simplified product comparison
- clearer product pages and checkout paths.
As a result, the platform expects a 25% increase in conversion driven by redesigned product pages and checkout optimization, alongside a 20% improvement in product discovery through enhanced search and filtering.
Practical case # 2: Riptide
Riptide manufactures e-skateboards designed for improved urban mobility. While the product itself was strong, the website failed to communicate its unique value proposition.
.avif)
Our team immediately started working on an emotional website design to build a digital platform that users could feel. The redesign emphasized experiential storytelling through motion video, focused product presentations, and simplified purchase flows. The revamped UI demonstrated the product in real-world scenarios to help users imagine themselves using it.
The outcome was immediate. Riptide sold $500k worth of skateboards within 2 months of launching the new website.
2. Customer acquisition cost
Customer acquisition cost (CAC) is the amount a company spends to acquire each new customer. It is heavily influenced by the efficiency of your product’s conversion funnel.
Take the following as a hypothetical example. Consider a marketing campaign with a $100,000 budget.
- At a 2% conversion rate, the campaign produces 2,000 customers. CAC is $50 per customer.
- At a 5% conversion rate, the same campaign produces 5,000 customers. CAC drops to $20.
The marketing spend is the same. The difference is how effectively the product converts visitors. Design, therefore, acts as a multiplier on marketing effectiveness.
Practical case: Fractal Protocol
Fractal Protocol provides a platform for digital marketing operations. As the product expanded, its interface grew dense and difficult to navigate.
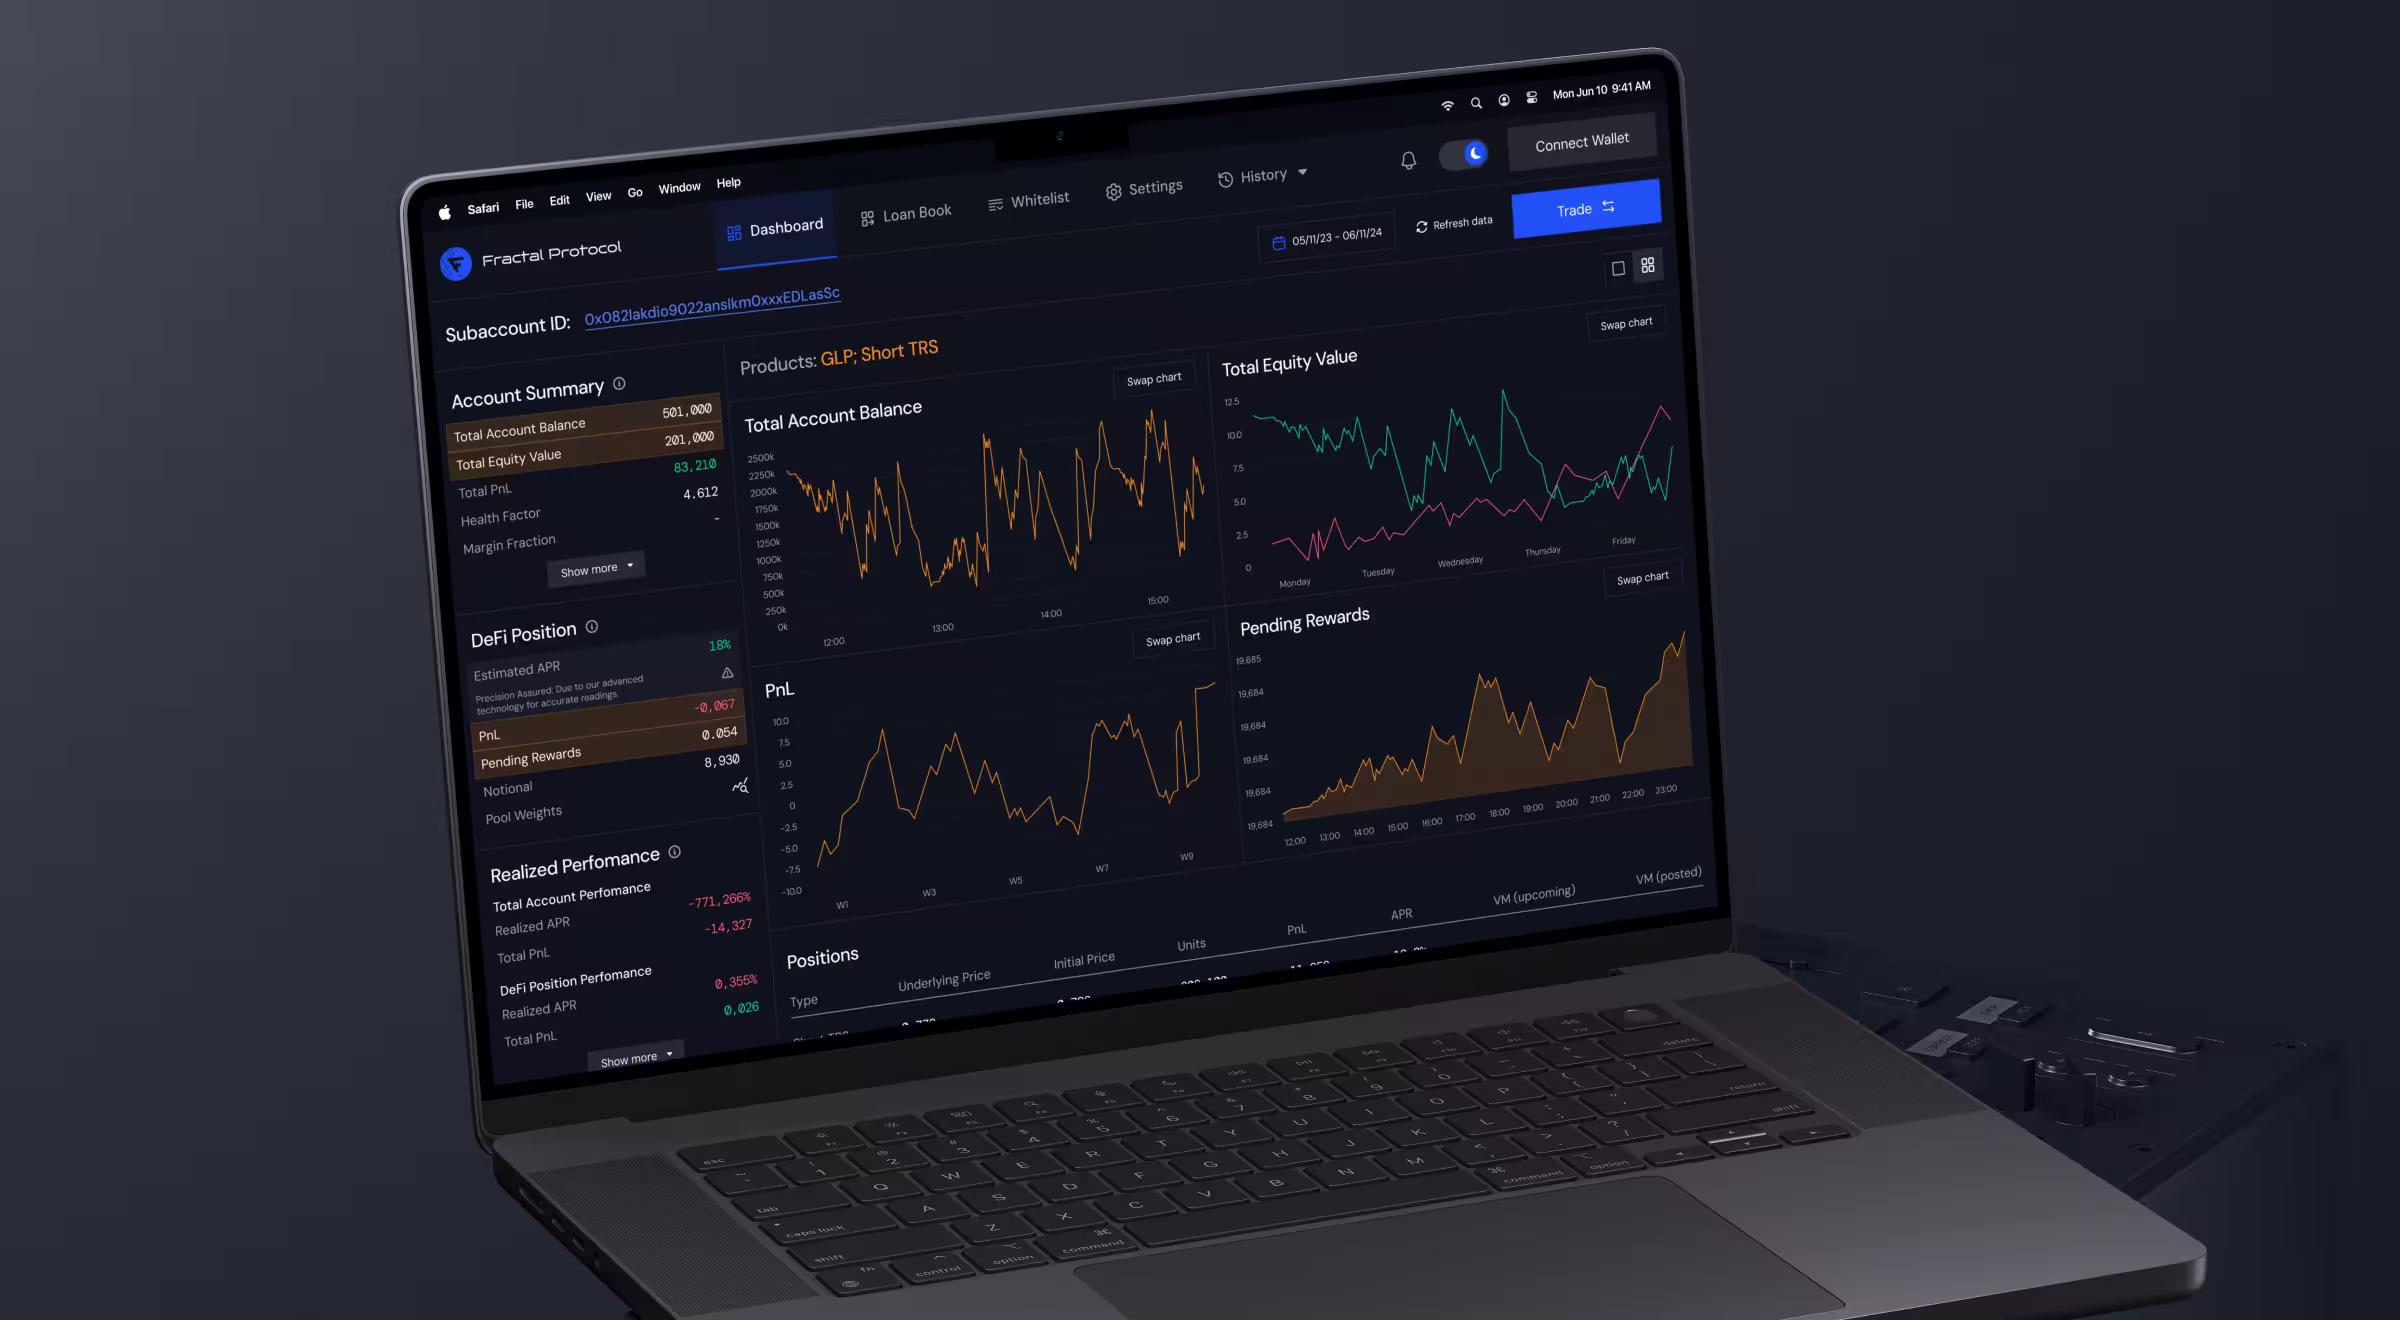
The redesign focused on restructuring information architecture and introducing a cohesive design system.
The result was a significantly more intuitive platform that allowed users to interpret data and act on insights more quickly. Following the redesign, the platform achieved a 165% improvement in usability and a 33% increase in user satisfaction.
🔍 Not sure your product needs a design system? Explore our Lead Designer’s design systems 101 to address any lingering hesitation.
3. Retention and lifetime value
Acquisition creates customers. Retention determines how much revenue those customers ultimately generate, which is why knowing how to improve customer lifetime value matters as much as filling the funnel.
Products that fail to deliver value early in the experience often see steep drop-offs during onboarding. When users cannot understand how the product helps them achieve their goals, engagement declines.
That is why retention depends on how efficiently the interface guides users toward meaningful outcomes.
Practical case: Kin Platform
The Kin ecosystem supports a large network of Web3 applications and developers. As the platform matured, its interface struggled to accommodate the growing complexity of the ecosystem.
.avif)
The redesign focused on simplifying navigation and refining onboarding flows.
The updated experience achieved:
- 25% increase in new user retention
- 40% reduction in user journey time
By helping users reach value faster, the platform strengthened long-term engagement. Retention followed usability.
Design is a financial lever, so use it strategically
Design determines whether product value is visible and actionable.
This is why companies with mature products look at design through financial metrics first. They examine how the product experience affects conversion, acquisition, retention, and lifetime value.
When these relationships are understood, design upgrades its position in the hierarchy of business priorities. It becomes an integral part of the company’s revenue infrastructure.
At Lazarev.agency, an AI product design agency, this perspective shapes every project we take on.
As our founder Kirill Lazarev often explains:
“We don’t optimize for you to like it. We optimize for you to make money.”
For product leaders evaluating the economic performance of their digital experiences, a useful starting point is identifying which revenue metric is being constrained by product design.
If that question resonates, the next step is practical. Reach out to Lazarev.agency to discuss how strategic UX and product design can strengthen the revenue mechanics inside your product.


.webp)


.avif)